
STARTEGIC PLAN FOR ROCAF
2024/2025 – 2028/2029
SEPTEMBER 2024
|
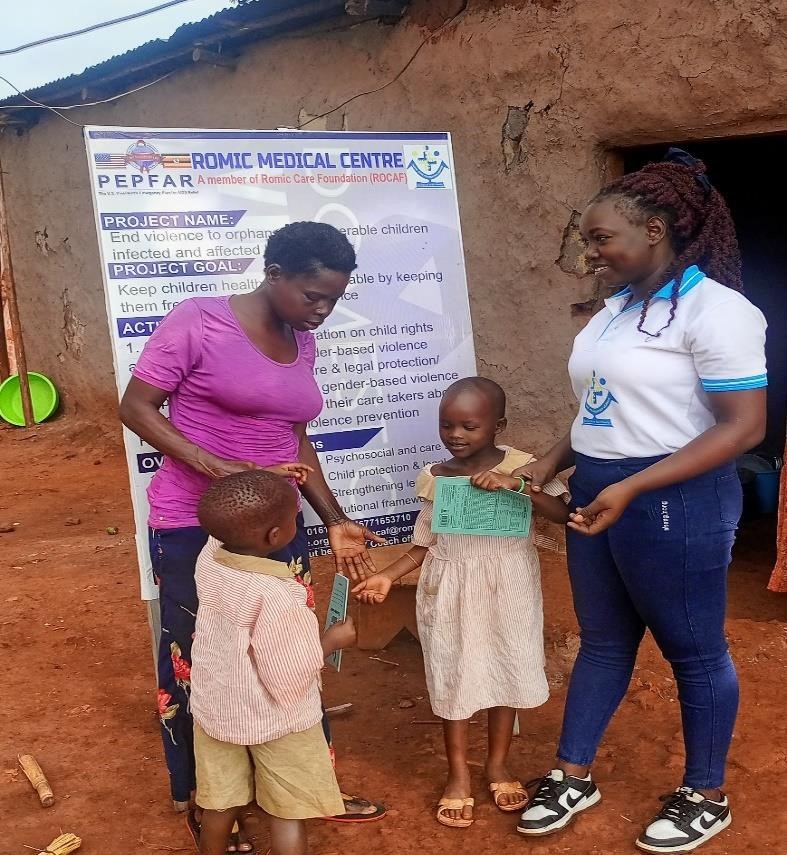 |
| ROCAF staff providing scholarstic materials to OVC in vulnerable community | |
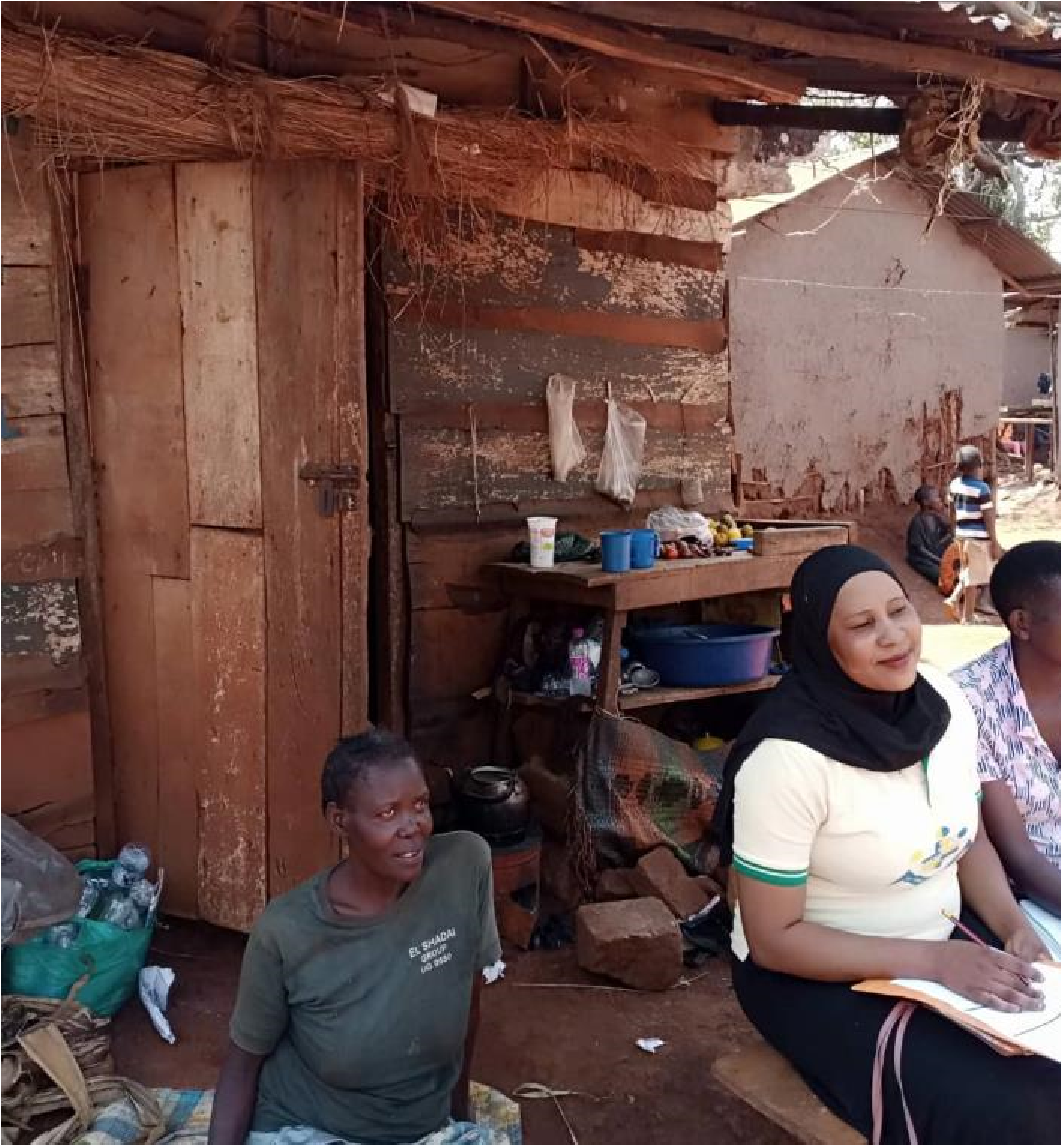
ROCAF Staff during community visit in sawuli, walukuba masese iii, Jinja city. |
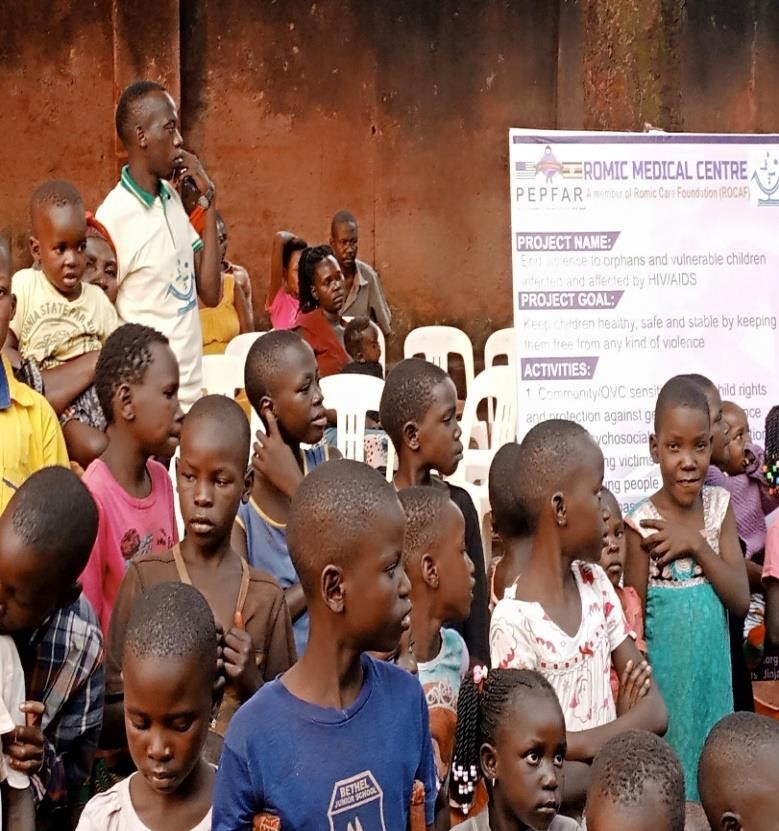
Community sensitization about OVC rights, GBV & HIV prevention. |
Approval Of ROCAF Strategic Plan For 2024/2025-2028/2029
Endorsed by Communication and M & E manager ROCAF:
Name……………………………………………. Signature………………… Date…………………
Prepared by Executive Director ROCAF:
Name……………………………………………. Signature…………………Date………………….
Approved by Chairperson Board of directors:
Name……………………………………………. Signature……………………. Date………………
TABLE OF CONTENTS
Introduction & Background ………………………………………………………………………………………………………………………….. 1
1.1: Location: ………………………………………………………………………………………………………………………………………………… 1
1.2: Registration status ………………………………………………………………………………………………………………………………….. 1
1.3 Vision ……………………………………………………………………………………………………………………………………………………….. 1
1.4 Mission …………………………………………………………………………………………………………………………………………………….. 1
1.5.0 Core values …………………………………………………………………………………………………………………………………………… 1
1.6 The Organization Structure ……………………………………………………………………………………………………………………. 2
2.0 Key Achievements In 2023 …………………………………………………………………………………………………………………….. 3
GBV Survivors received, examined and offered medical care. ……………………………………………………………………. 3
Sexual gender-based violence (SGBV) cases Linked to receive post exposure prophylaxis (PEP) & FP
services…………………………………………………………………………………………………………………………………………………………… 3
Linkage of GBV cases to Legal services and Forensic evidence collection…………………………………………………. 4
HIV care services …………………………………………………………………………………………………………………………………………… 4
HIV Counseling and Testing, Linkage of Positives to Care ………………………………………………………………………….. 4
Condom distribution to HIV hotspots …………………………………………………………………………………………………………. 5
Awareness creation on HIV prevention ………………………………………………………………………………………………………. 5
2.3.0 PEPFAR Funded GBV Project ………………………………………………………………………………………………………………. 5
Key PEPFAR Funded Activities that were Implemented and the outputs ………………………………………………….. 5
Awareness creation ……………………………………………………………………………………………………………………………………….. 7
2.5.0 Key challenges ………………………………………………………………………………………………………………………………………. 8
2.6.0 Romic Medical Centre OPD and IPD services for Jan-December 2023 …………………………………………… 8
Activity Photos for activities conducted in 2023 …………………………………………………………………………………………. 9
3.O Situation Analysis ………………………………………………………………………………………………………………………………….11
3.1 Tuberculosis Situation in Uganda & Jinja ………………………………………………………………………………………………11
3.2 Malaria Situation …………………………………………………………………………………………………………………………………….12
3.2.1 The Burden of Malaria in Uganda ……………………………………………………………………………………………………….12
3.2.2 Epidemiology of malaria in Uganda …………………………………………………………………………………………………….13
3.2.3 Control and policy framework for malaria in Uganda ………………………………………………………………………14
3.3 HIV Situation in Uganda & Jinja ……………………………………………………………………………………………………………..14
3.3.1 HIV Prevalence by Region …………………………………………………………………………………………………………………..15
3.4 Sexual Gender Based Violence (SGBV) ………………………………………………………………………………………………..16
3.5 Orphans and vulnerable children (OVC) ……………………………………………………………………………………………..17
4.0swot-analysis 4.1 ……………………………………………………………………………………………………………………………………18
4.2 Collaborations ………………………………………………………………………………………………………………………………………..19
4.3 Governing Board ……………………………………………………………………………………………………………………………………20
5.0 Thematic Program Areas. ………………………………………………………………………………………………………………………21
SO5.1To mitigate the spread of HIV/AIDS and offer comprehensive care and support to individuals
impacted by the virus in greater Jinja, with a focus on AGYWs, men, and youths. …………………………………21
SO, 5.2 Raise awareness on HIV prevention care and treatment among youths, Men and Women ……..21
SO5.3 To Create Awareness about Tb and contribute to increased proportion of people with Tb
symptoms that seek appropriate care from health facilities ………………………………………………………………………22
SO5.4 To conduct Tb contact tracing to index Tb patients and contribute to increased Tb preventive
therapy (TPT) uptake among eligible Contacts under 5 and 5+ yrs. ………………………………………………………..22
SO5.5 To Strengthen Public Private Mix (PPM) for TB ……………………………………………………………………………..22
SO5.6 To contribute to reduced Malaria infections and Zero deaths in greater Jinja …………………………….23
SO5.7 To strengthen integrated Case Management of Malaria in health Facilities ………………………………….23
SO, 5.8 Improve access to safe water, sanitation, and hygiene (WASH) facilities and promote good nutrition
practices among vulnerable populations, particularly children and women. …………………………….24
SO5.9 Improve and increase the accessibility by 30% for victims to essential, specialist, safe and
adequate multisectoral services. ………………………………………………………………………………………………………………….25
SO5.10: Enhance an Improved prevention of GBV through changes in behavior, practices and attitudes.
………………………………………………………………………………………………………………………………………………………………………25
SO5.11 To contribute to poverty reduction by Fostering socio-economic resilience and sustainable
livelihoods among vulnerable populations…………………………………………………………………………………………………..26
SO5.12 Strengthen Environmental protection and uptake of Climate resilience/protection Technologies
in 50 Schools and 50 health facilities in response to Climate Change. ……………………………………………………..26
SO5.13: Improve the quality, accessibility, and inclusivity of education for 2500 disadvantaged groups by
2028 through capacity-building for educators, fostering youth leadership in extracurricular activities,
and promoting gender equality in the learning environment. ……………………………………………………………………26
SO5.14: Contribute to the reduction in child poverty and deprivation through comprehensive
prevention and response programs. ……………………………………………………………………………………………………………27
SO5.15. To provide accessible and affordable medical care services to vulnerable communities,
improving their overall health and well-being. ……………………………………………………………………………………………28
6.0 Monitoring and Evaluation Activities …………………………………………………………………………………………………….29
7.0 MONITORING AND EVALUATION FRAMEWORK ………………………………………………………………………..85
8.0 ORGANIZATIONAL BUDGET FOR ROCAF 2025/2026, (1USD RATED AT 3650UGX)…………. 152
Acknowledgement
Romic Care Foundation-ROCAF takes this opportunity to express its deep appreciation and sincere thanks to all those who participated in the development of this 5-year Strategic Plan 2024/2025-2028/2029. The process of developing this ROCAF Strategic plan was highly participatory involving ROCAF staffs and key stakeholders. This 5-year strategic plan was developed over a period of six months using an inclusive and broad consultation process among all our thematic program area stakeholders in the region. The process was led by the technical team of ROCAF Program areas under the leadership of the Executive Director Mr. Kanabiro Robert.
We extend our heartfelt gratitude to the ROMIC Care Foundation team, whose dedication and expertise have been instrumental in shaping this strategic plan. Specifically, we thank:
-
-
-
- Mr. Kanabiro Robert, Executive Director, for his visionary leadership
- Mr. Grace Basimbe, General Secretary, Board of Directors, for her guidance and support
- Mr. Buluke Ronald, In-Charge, ROMIC Medical Centre, for his tireless efforts in healthcare delivery
- Mr. Were Edward, Communication & Dissemination Officer, M&E Officer, TB Focal Person, and Environment Officer, for his multifaceted contributions
- Mrs. Adikini Caroline, Treasurer, Board of Directors, and Admin & Finance Officer, for her financial stewardship and administrative expertise.
-
We also appreciate the invaluable support and collaboration from our partners, including:
-
-
-
- Uganda Police Force, for their critical role in providing GBV services
- Directorate of Public Prosecutions, for their partnership in promoting justice and accountability
-
-
Furthermore, we acknowledge the generous funding and guidance from:
-
-
-
- PEPFAR-Uganda, for their commitment to supporting our mission
- Jinja City and Local Government, Jinja Department of the NGO/CBO, for their ongoing support and collaboration
-
-
This strategic plan is a testament to the power of collaboration and collective effort. We are grateful for the trust and confidence placed in us and commit to continuing our work to make a meaningful difference in the lives of vulnerable populations in greater Jinja and beyond.
-
-
List Of Abbreviations/Acronyms:
AGYW: Adolescent Girls and Young Women
APN: Assisted Partner Notification
ART: Anti-Retroviral Therapy
CBO: Community-Based Organization
CLTS: Community-led Total Sanitation
CP: Child Protection
DWSCC: District Water and Sanitation Committee
ECD: Early Childhood Development
FP: Family Planning
GBV: Gender-Based Violence
HAAM: Household Action Against Malaria
HCT: HIV Counseling and Testing
HUMC: Health Unit Management Committees
ICF: Individual Case Forms
ICTLM: Integrated TB/Leprosy Management
ITC: In-patient Treatment Centers
IEC: Information, Education, and Communication materials
MAAM: Mass Action Against Malaria
MAM: Moderately Acutely Malnourished
M&E: Monitoring and Evaluation
MIS: Malaria Indicator Survey
MOH: Ministry of Health
OVC: Orphans and Vulnerable Children
OPD: Outpatient Department
OTC: Out-patient Treatment Centers
PEP: Post-Exposure Prophylaxis
PEPFAR: Presidential Emergency Preparedness Fund for HIV/AIDS Response
PPM: Public-Private Mix
PSS: Psychosocial Support
PTA: Parent-Teacher Associations
ROCAF: Romic Care Foundation
RTA: Road Traffic Accident
SAM: Severely Acutely Malnourished
SGBV: Sexual Gender-Based Violence
SMC: School Management Committees
SRHR: Sexual Reproductive Health and Rights
TB: Tuberculosis
TPT: TB Preventive Therapy
UPHIA: Uganda Population HIV Impact Assessment
WSCs: Water and Sanitation Committees
Definition Of Terms:
Aggravated Defilement: Sexual intercourse between an adult and a child below 14 years of age.
Capacity Building: Programs or initiatives aimed at strengthening individuals’, communities’, or organizations’ abilities to achieve their goals and improve their circumstances.
Child Abuse: Any act or failure to act that causes harm to a child, including physical, sexual, emotional, or psychological abuse.
Community-Based Organization (CBO): A non-profit organization operating at the local level, addressing community needs and involving community members in decision-making.
Defilement: Sexual intercourse between an adult and a child below 18 years of age.
Domestic Violence: Any physical, sexual, or psychological abuse that takes place within a domestic or family relationship.
Forensic Examination: The use of scientific methods and techniques to investigate crimes, including analyzing evidence such as DNA, fingerprints, or other physical evidence.
Gender-Based Violence: Violence or abuse directed against individuals based on their gender, including physical, emotional, or sexual harm.
Hygiene: The practices and actions taken to maintain cleanliness and prevent the spread of illnesses.
In-Kind Donations: Donations of goods or services rather than money, such as food, clothing, or volunteer time.
Medicolegal: Relating to the application of medical knowledge and expertise in legal contexts, such as forensic medicine or medical testimony in court.
Physical Assault: An act of physical violence that is not sexual in nature.
Rape: Non-consensual penetration of the vagina, anus, or mouth with a penis, other body part, or an object.
Sanitation: The provision of facilities and services for the safe disposal of human waste, garbage, and other waste materials.
Simple Defilement: Sexual intercourse between an adult and a child of 14 years and above.
Social Enterprise: An organization or initiative that uses business principles to address social or environmental issues, often generating revenue to sustain its activities.
Sustainable Development: Economic, social, and environmental development that meets present needs without compromising future generations’ ability to meet their own needs.
Torture: The intentional infliction of severe pain or suffering, often for the purpose of obtaining information or for punishment.
Vulnerable Populations: Groups or individuals at higher risk of harm or exploitation, such as children, women, or marginalized communities.
Executive Summary
ROMIC Care Foundation (ROCAF) is a leading organization in Uganda dedicated to contributing to a society where all women, youth, children, and the elderly are treated with dignity and have sustainable livelihoods. Our mission is to advance socio-economic development, promote gender equity, education, health, WASH, climate change, skilling of communities, and sustainable development.
With a focus on vulnerable populations in greater Jinja, we implement comprehensive programs across nine thematic areas:
HIV/AIDS prevention, care, and support
TB prevention, care, and treatment
Malaria prevention and control
WASH and nutrition
Gender-based violence prevention and response
Socio-economic empowerment
Environment and climate change
Education for women, youth, and children
Orphans and vulnerable children support
In partnership with government agencies, funders, and stakeholders, we leverage our expertise and resources to deliver impactful interventions. Our strategic plan outlines bold objectives and strategies to address pressing development challenges, building on our strengths and experiences.
Key Highlights:
Comprehensive programming across nine thematic areas
Strong partnerships with government agencies, funders, and stakeholders
Commitment to sustainable livelihoods and socio-economic development
Focus on vulnerable populations in greater Jinja
Dedicated team with expertise in development programming
Introduction & Background
1.1: Location:
Located in Jinja city, Southern Division at Kidera road, Craft village Rubaga, opposite Jinja Gadaffi police barracks.
1.2: Registration status
𝗥𝗼𝗺𝗶𝗰 𝗖𝗮𝗿𝗲 𝗙𝗼𝘂𝗻𝗱𝗮𝘁𝗶𝗼𝗻 is an indigenous Community-Based organization, registered with jinja district in 2018 [ RegNo; JJA/09/2018/00456], also registered with jinja city in 2023 [JC/302/CBO/2023] and in 2023 registered as a Company limited by guarantee without shares [Reg NO; 80034378759011] operating in peri- urban and rural communities Jinja. Though we serve the communities in various aspects, special focus is put on prevention and responding to Gender-based violence and restoring hope to the underprivileged and marginalized in society.
ROCAF Operates Romic medical Centre which is registered by Ministry of health and offers medical care services to the vulnerable community. And it offers these services; General medical services, medicolegal services and laboratory services.
Romic Care Foundation (RCF) sources of funds include: – grants, membership subscriptions by community members, social enterprise, medical services fees from the medical Centre, in kind donations and individual donation
1.3 Vision
The Leading Organization in Uganda to contribute to a society where all women, youth, children, and elderly are treated with dignity and have sustainable livelihoods.
1.4 Mission
We exist to contribute to socio-economic development and advancement of women, youth, Children and the elderly through promotion of gender equity, education, health, WASH, climate change, skilling of communities and sustainable development.
1.5.0 Core values
1.5.1 Professionalism
1.5.2 Empathy Respect Integrity
1.5.3 Ethical considerations in all our work Confidentiality
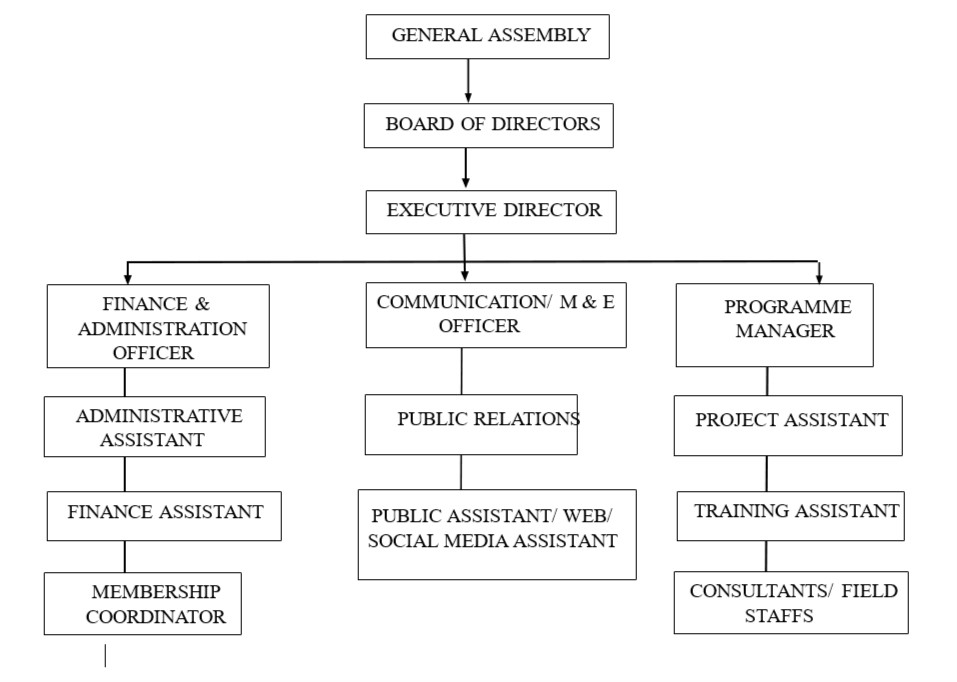
1.6 The Organization Structure
ROCAF – ORGANISATION STRUCTURE
2.0 Key Achievements In 2023
2.1 GBV Survivors received, examined and offered medical care.
Table1: GBV Survivors received, Examined and offered medical care (Collection of forensic evidence, Psycho-social support-PSS)
| Form of Gender Based cases & other cases | No.s for 2023 | |||||
| J-M | A-J | J-S | O-D | Overall total | ||
| 1 | Simple defilement | 70 | 112 | 86 | 74 | 342 |
| 2 | Aggravated defilement | 7 | 10 | 13 | 7 | 37 |
| 3 | Rape | 9 | 3 | 12 | 5 | 29 |
| 4 | Anal sex | 2 | 2 | 1 | 0 | 5 |
| 5 | Domestic Violence | 59 | 79 | 101 | 124 | 363 |
| 6 | Child abuse/torture | 1 | 6 | 7 | 10 | 24 |
| 7 | Physical assault | 453 | 792 | 689 | 613 | 2547 |
| Total | 601 | 1004 | 909 | 833 | 3347 | |
2.1.1 Sexual gender-based violence (SGBV) cases Linked to receive post exposure prophylaxis (PEP) & FP services
Table2: Sexual gender-based violence (SGBV) cases Linked to PEP, HCT
| Indicator | No | Percentage |
| No of SGBV cases | 413 | |
| No Offered HCT | 413 | 100% |
| No Eligible for PEP | 395 | |
| No of SGBV Linked to PEP | 395 | 100% |
| No of SGBV Linked to PEP and
feedback received |
390 | 98% |
| No. of SGBV cases that are Women
Offered emergency Family planning |
78 |
2.1.2 Linkage of GBV cases to Legal services and Forensic evidence collection
Forensic evidence collection / presentation of professional evidence in court. A total of 149 survivors were represented in court and professional forensic evidence presented
Table3: Linkage to Legal services and presented Forensic examination evidence
| Sn. | Cases | No | Percentage |
| 1 | Defilement | 94 | 63.1 |
| 2 | Rape | 6 | 4 |
| 3 | Anal sex cases | 2 | 1.3 |
| 4 | Domestic violence | 16 | 10.7 |
| 5 | Child abuse | 1 | 0.7 |
| 6 | Physical assault | 30 | 20.1 |
| Total | 149 |
2.2 HIV care services
2.2.1 HIV Counseling and Testing, Linkage of Positives to Care
From Jan-December 2023, The Organization offered Facility based HIV counseling and testing (HCT).
| Age -Yrs. | No offered HCT | Total tested | No HIV
positives identified |
No of
HIV positive Linked |
|||
| J-M’23
Q1 |
A-J’23
Q2 |
J-S’23
Q3 |
O-D’23 Q4 | ||||
| 0-5 | 0 | 11 | 8 | 8 | 27 | 0 | 0 |
| 6-12 | 21 | 8 | 12 | 21 | 62 | 1 | 1 |
| 13-17 | 64 | 56 | 81 | 122 | 323 | 0 | 0 |
| 18-30 | 69 | 66 | 90 | 86 | 311 | 17 | 17 |
| 31-40 | 27 | 14 | 55 | 71 | 167 | 11 | 11 |
| 41+ | 20 | 9 | 36 | 25 | 90 | 0 | 0 |
| Total | 201 | 164 | 282 | 333 | 980 | 29 | 29 |
Offered HCT to 980 individuals, identified 29 HIV positives, 2.9 % positivity rate and linked 100% to ART,
Mpumudde HC IV, which is a public facility supports manage our HIV positive clients
2.2.2 Condom distribution to HIV hotspots
Distributed 3533 pieces of condoms in Bars- HIV hot spots in Mafubira and Mpumudde
2.2.3 Awareness creation on HIV prevention
Sensitized 4500 individuals on HIV prevention and distributed 1000 IEC materials on HIV prevention.
2.3.0 PEPFAR Funded GBV Project
Implemented: End Violence to Orphans and Vulnerable children affected and infected with HIV/AIDS in Jinja.
Romic Care Foundation received funding to implement activities on GBV, Key results
2.3.1 Key PEPFAR Funded Activities that were Implemented and the outputs
| Activity Code | Activity
Description |
Results/out puts | Comments | ||||
| Activity | 1: | Inception meeting with 26 Jinja district and City key stakeholders | 25 stakeholders (17 female and 8male) attended the meeting. | Created community ownership of the project and introduce the project to the stakeholders: – Shared Activities, Expected outputs and method of implementation and target group and Coverage | |||
| Activity | 2: | Identifying & registering OVCs | 290 OVC were identified & registered to benefit from the project activities | There was an overwhelming No. of OVC who wanted and needed to be registered for the program to benefit, that were promised to be included also in the program.
The beneficiaries were selected using MLG&SD guidelines and among the following categories;
households;
disability; |
|||
living on the streets |
||||||||
| Activity 3: | Organize workshops for OVC, community leaders and parents to educate/train about child rights and responsibilities of care takers | 3 workshops attended
80 OVC, 10 community leaders and 70 parents, there were oriented about their rights and responsibilities on caring for OVCs (children and women) |
We in the identification and registration process, we worked with District Community Development Officer, Sub- County community development officers, the Probation Officers, LC1 chairpersons,
Child and family Protection committees, District Union of Disabilities and women representatives. The community through their local council one chairpersons were the whistle blowers and our work was to assess and enroll them for support following the MLG&SD guidelines |
|||||
| Activity 4: | Visit Local communities sensitize them
about the rights of OVC |
7 sensitization sessions were conducted in the communities of
Buwenge Sub County and Walukuba, Masese III in Jinja City and 125 households were mobilized and 241 people were sensitized about the rights of OVC. |
A total of 4 sensitization visits was conducted to 70 households about the rights of OVC and 141 people were sensitized about the rights of OVC.
|
|||||
| Activity | 5: | Provide psychosocial care
and legal protection/suppor t to young victims of GBV. |
A total of 85 young victims of GBV were supported with psychosocial care and legal protection services. | -Some of young victims of GBV expected direct financial support because they face a constant challenge in finding money for food
|
||||
| Activity | 6: | Printing and distribution of IEC materials on the prevention of HIV and GBV. | 1750 Brochures were printed and distributed 1000 Waterproof stickers were printed and distributed 100 branded T-shirts were printed and distributed | There is need to translate IEC materials to local language | ||||
| Activity | 7: | Radio talk shows on GBV, HIV | 3 Radio talk shows were conducted on protection of children rights and GBV and reached about10,000listeners
(community members). |
This objective was met because a total of 10,000listeners (community members) on protection of children rights and GBV through Radio talk shows as planned. | ||||
| Activity | 8: | Sensitize the young people and their caretakers about GBV and
HIV prevention |
4 Workshops Were Organized in Mpungwe and Sawuliyako Walukuba MaseseIII, | Reached 158 beneficiaries versus the budgeted Target of 20 | ||||
2.4 Awareness creation
In 2023, Participated in16 days of Activism against Violence against women/girls organized in Jinja City by Busoga Regional Director of public prosecutions at Jinja Railway grounds, sensitized communities on GBV, HIV prevention and link between GBV and environment
Participated also on Rubaga Youth Day sports gala, offered HIV Awareness creation, HCT and GBV screening.
2.5.0 Key challenges
Inadequate IEC materials on SGBV, No/lacking Safe shelters for SGBV survivors to be supported, inadequate HMIS tools and generally we lack a strong financial support for smooth running of our activities.
2.6.0 Romic Medical Centre OPD and IPD services for Jan-December 2023
Romic Medical Centre offers OPD and Inpatient services to all age groups
| Sn. | Indicator | No |
| 1 | Total OPD attendances | 5400 |
| 2 | Total In patient attendances | 1080 |
| 3 | No confirmed malaria cases treated | 876 |
| 4 | Animal bites | 13 |
| 5 | Road Traffic Accident (RTA) | 203 |
| 6 | Uncomplicated Malaria cases | 250 |
| 7 | OPD Attendees screened for Malnutrition (MUAC) | 500 |
| 8 | OPD Attendees Assessed for DM(RBS) | 320 |
| 9 | OPD Attendees screened for TB(ICF) | 5100 |
2.7 Activity Photos for activities conducted in 2023
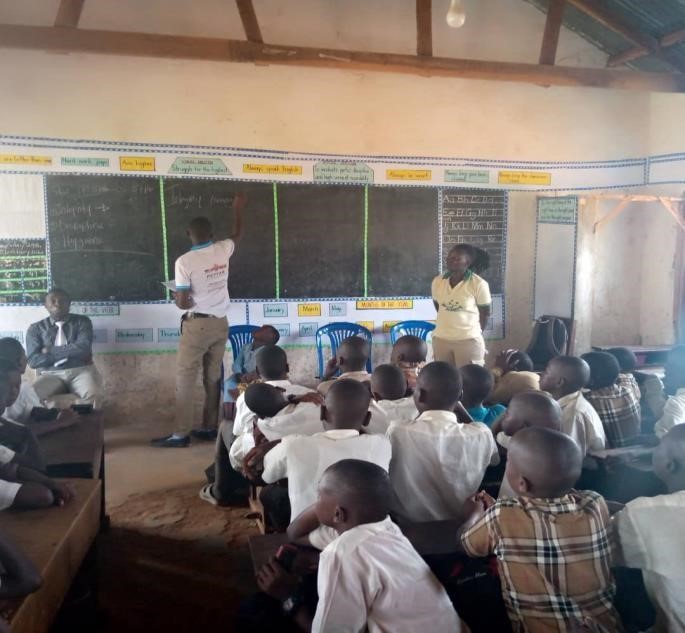
Figure 1: ROCAF staff raising awareness about WASH at Gertrude Academy Primary Buwenge
|
 |
|
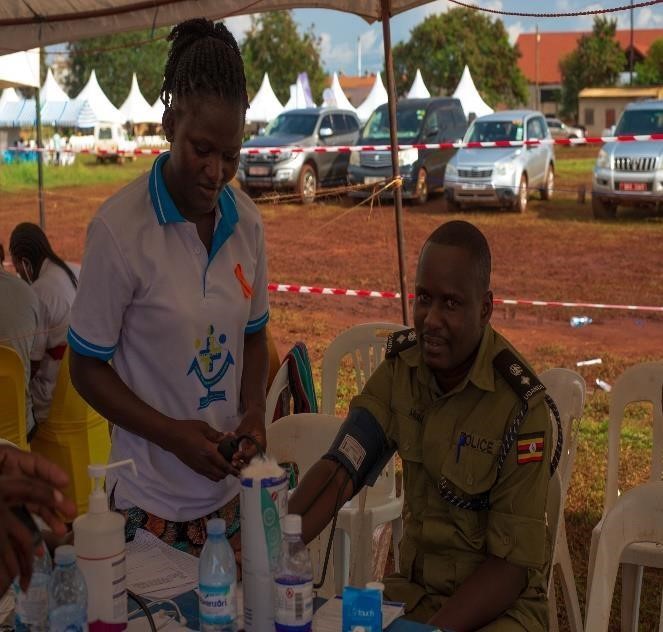
| Figure 2: HIV testing outreach by ROCAF staff to the uniformed officers. | ||
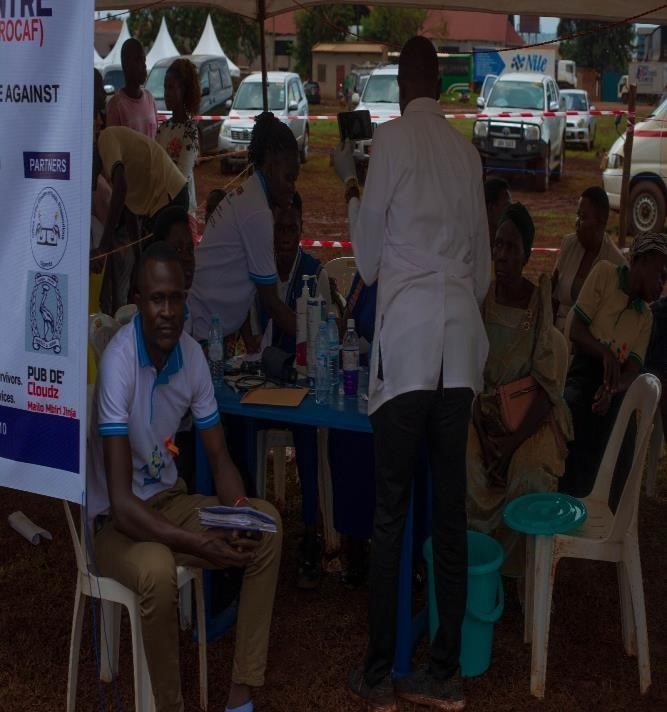
Figure 3: ROCAF staffs offering HCTand GBV awareness creation and screening for GBV during the event marking the 16 days of activism against GBV for Jinja City, at Railway grounds Jinja City
|
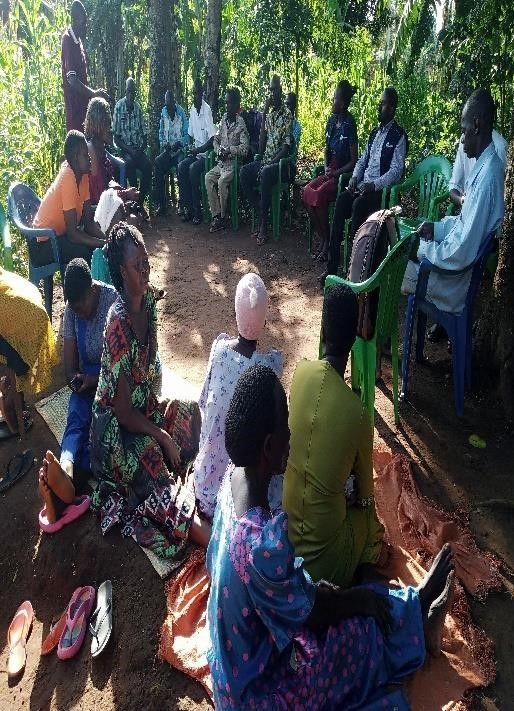
Figure 4: Young People, Parents and Community Leaders of Mpungwe Village, Buwenge Sub county in Workshop About HIV And GBV Prevention organized by ROCAF under PEPFAR Funding. |
|
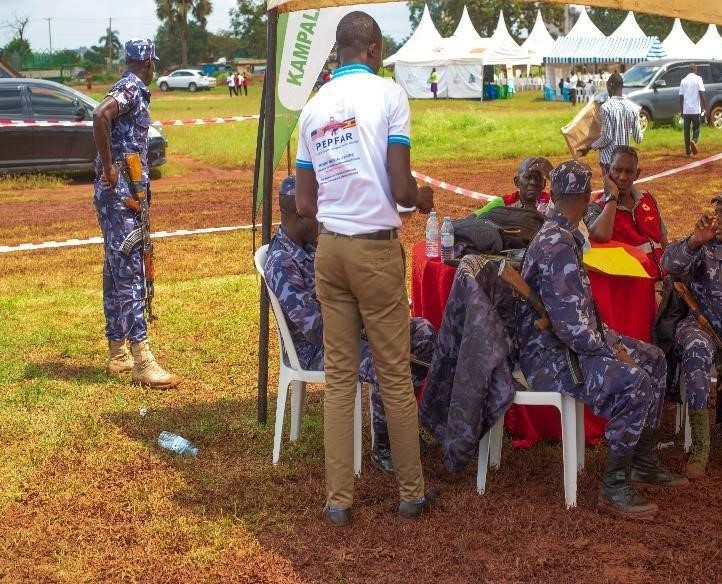
Figure 5: ROCAF Director raising awareness on GBV to police officers during the event marking the 16 days of activism for Jinja City, at Railway grounds Jinja City |
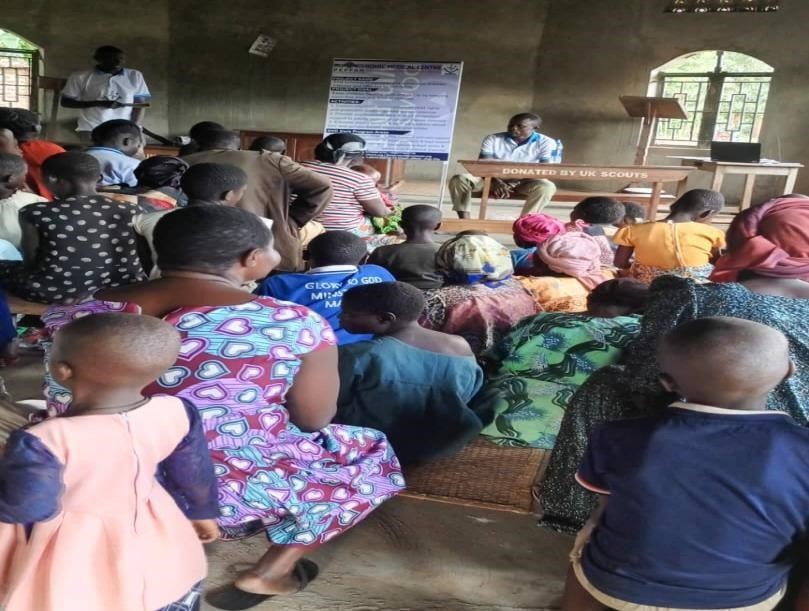
Figure 6: Sensitizing Community of Mpungwe on GBV and children rights and protection
|
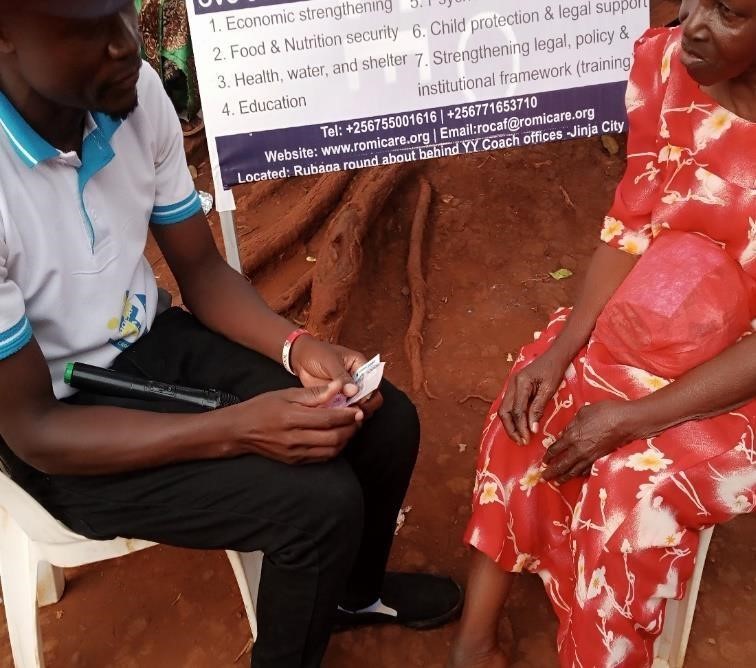
Figure 7: A physically disabled single grandmother being given some financial help by ROCAF staff. |
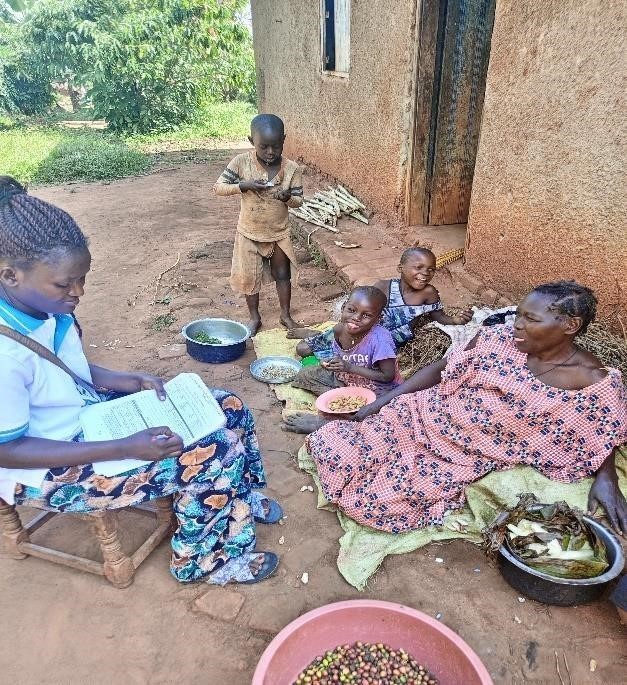
Figure 8: Staff during OVC identification and registration in Mpungwe village, Buwenge |
3.0 Situation Analysis
3.1 Tuberculosis Situation in Uganda & Jinja
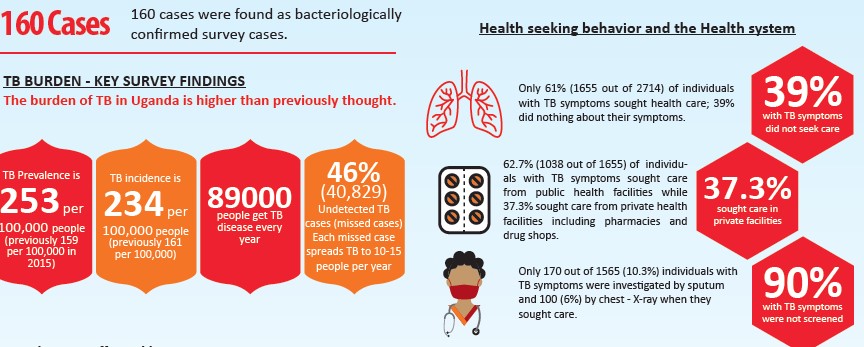
Source: 2015/16 Prevalence survey
Jinja TB case notification is at 70% with 40% TB patients accessing Gene X-pert testing), Treatment Success rate was 80% and Tb contact screening at 80% (NTLP report 2022/23)
3.2 Malaria Situation
3.2.1 The Burden of Malaria in Uganda
Malaria in Uganda is largely influenced by the tropical climate—the temperature and rainfall. The entire population of Uganda is at risk of malaria; however, some groups are at higher risk than others. The most vulnerable groups include:
-
-
-
- Children under 5 years of age o Pregnant women, especially prime gravidae o People living with HIV/AIDS o People with sickle cell disease
- Travelers from areas where there is little or no malaria (due to low immunity to malaria)
-
-
3.2.2 Epidemiology of malaria in Uganda
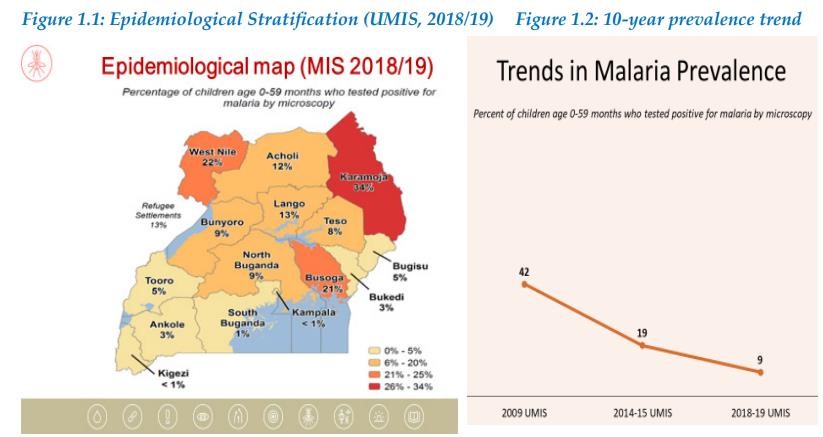
Busoga region malaria Prevalence among children 0-59 is 21% higher than then the national average 9% (UMIS, 2018/19) and Jinja district and City with Swamps and sugar cane growing activities are having high malaria prevalence 3.2.3 Control and policy framework for malaria in Uganda
i) Preventing mosquitoes from biting humans ii) Reducing the population of mosquitoes iii) Reducing the malaria parasite load in humans iv) Sensitization about prevention and early treatment seeking
v) Surveillance, Epidemic Preparedness and Response
3.3 HIV Situation in Uganda & Jinja
Annual incidence of HIV among adults (defined as those aged 15 years and older) in Uganda was
0.29%: 0.38% among women and 0.20% among men.
Prevalence of HIV among adults in Uganda was 5.8%. HIV prevalence was higher among women (7.2%) than among men (4.3%).
The prevalence of VLS among adults living with HIV in Uganda was 75.4%: 78.3% among women and 69.8% among men. Note, these estimates of
VLS are among all adults living with HIV regardless of their knowledge of HIV status or use of antiretroviral therapy (ART).
3.3.1 HIV Prevalence by Region
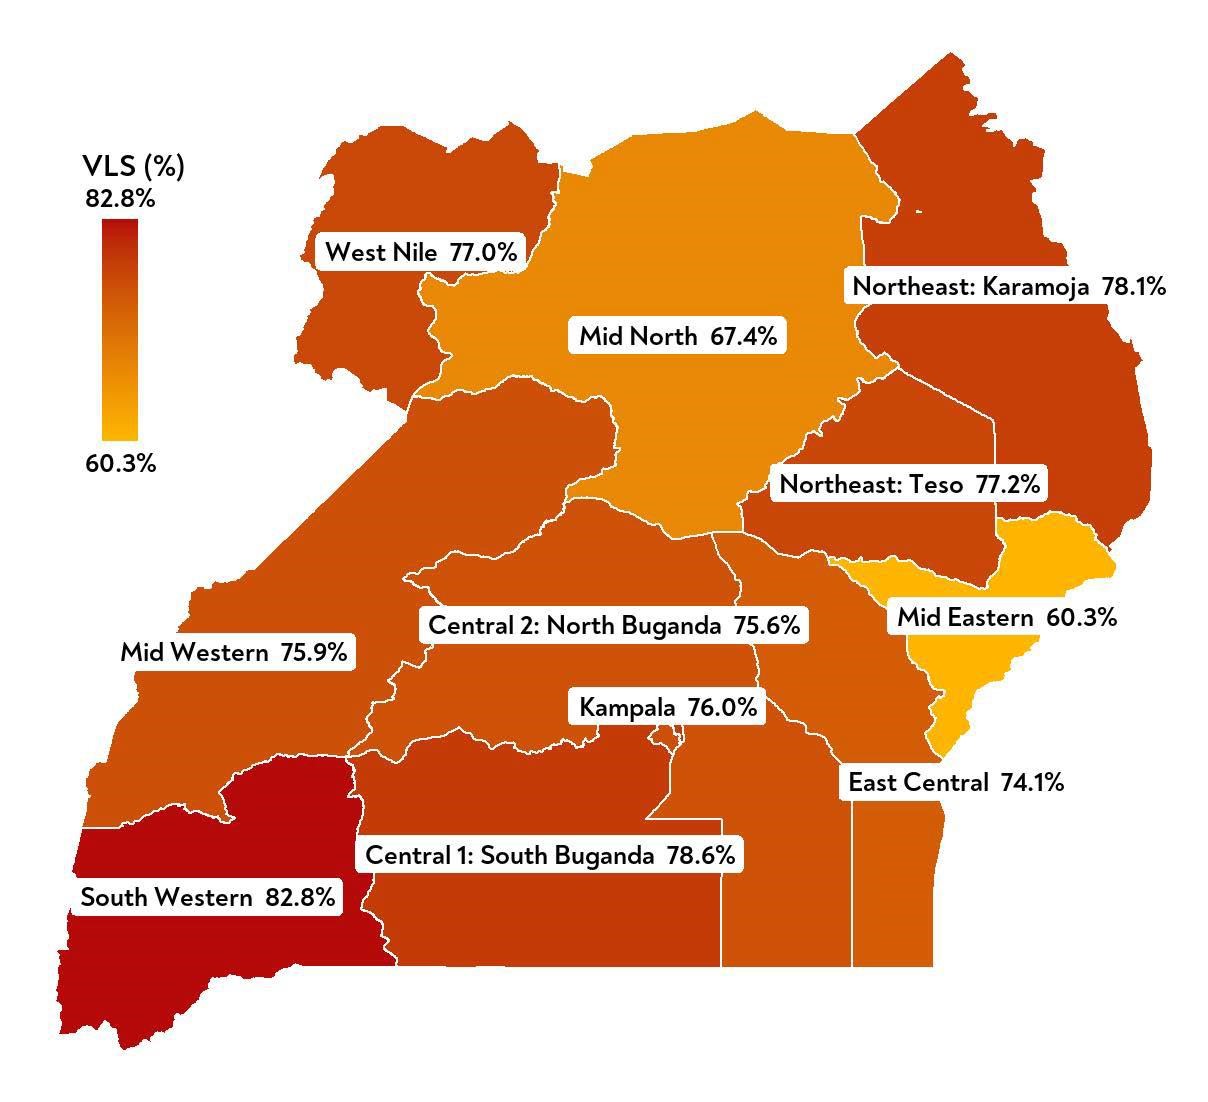
Source UPHIA 2020 Report
Uganda has met the second 95-95-95 target, over 95% of adults living with HIV who were aware of their status were on ART, well in advance of the 2025 target date, and among those on ART, the country is approaching the third 95 target for the prevalence of VLS.
-
-
-
- However, progress towards the achievement of the first 95, awareness of HIV status among adults living with HIV remains below 90% (the UNAIDS target for 2020), so there is a pronounced need to refine case finding strategies to address gaps in the first 95. Strategies that engage young people in HIV prevention and case finding efforts are needed.
- Women continue to bear a higher burden of HIV than men. This suggests a continued need for interventions to prevent infection in girls and
-
-
women, as well as robust PMTCT services, and other services to support the health and welfare of women living with HIV and their families.
-
-
-
- There are regional differences in the prevalence of HIV and VLS that may warrant regionalized interventions. A differentiated service delivery
-
-
approach to providing HIV services, tailored to meet the needs of men and women of different ages, lifestyles, and communities may also help address variation gaps in VLS.
-
-
-
- If Uganda can improve HIV awareness, the country should be well-positioned to reach the UNAIDS 95-95-95 targets by 2025. The country
-
-
can reach these targets by implementing strategies that deliver HIV diagnostic services and access to lifesaving ART to the underserved. To
move closer to the UNAIDS goal of ending the AIDS epidemic by 2030, there should be an emphasis on ongoing surveillance to detect new HIV
infections, coupled with the timely the provision of treatment and combination prevention services to interrupt further transmission (UPHIA, 2020)
3.4 Sexual Gender Based Violence (SGBV)
Gender-Based violence (GBV): refers to harmful acts directed at an individual based on their gender. It is rooted in gender inequality, the abuse of power and harmful norms.”
GBV is a pervasive problem with significant consequences for women, men, children and communities as a whole. It not only violates the human rights of the survivors, but also severely undermines the nation’s economic and social development and security.
Despite many legal protections and policies, GBV remains rampant and widely tolerated in Uganda.
56% of women have experienced spousal violence; 58% of women and 44% of men believe that wife beating is justified; 22% of women and 8% of men, 35% of girls and 17% of boys have experienced sexual violence; 30% of widows are unlawfully deprived of their home, land, or other economic assets after the death of her spouse;
Nationally, prevalence of violence against women who have ever been married is high, 22.3% is physical, 16.6% sexual violence, 9.3% is physical and sexual. Among Teenagers 15-19years 23.5% physical violence, 16.8% sexual, and physical plus sexual is at 9.4% (UDHS 2016, UBOS)
In 2019 Busoga region was the 2nd region with highest cases of GBV at 9564 and in 2020 it was the third region with 8643 cases, North central reported the highest (UDHS 2016).
DHIS2 data indicates Busoga leading in teenage pregnancy with Buyengo Town council and
Butagaya sub county have teenage pregnancy rates of 26%
Sexual violence (including rape and defilement) and Domestic Violence are among the leading crimes reported to the Uganda Police Force.
The problem has been exacerbated by the outbreak of covid 19 pandemic which has led to an increase in cases of Domestic violence by 29% with the majority of the victims being women and girls. Defilement increased by 3.8% with 14,134 cases reported compared to 13,613 in 2019, with murder as a result of domestic violence increasing by 16.1%. (Police crime report 2020).
Socio-economic impact:
GBV results in reduced productivity. The economic burden of domestic violence in Uganda is UGX 77.5 billion per year. This includes the cost of healthcare, social welfare and legal services. The experience of domestic violence also leads to reduced earnings and lower productivity by survivors, as they often miss days of work due to injuries and mental health problems, as well as being less productive at work
3.5 Orphans and vulnerable children (OVC)
With 57% of our population below the age of 18, Uganda is a young country and there is no doubt that our future lies with our children. In 2040, when our national Vision is to be a middleincome country, children being born now will be the productive engine of our economy.
Basic child rights:
Nutrition, Health, Water, Education, Shelter, Sanitation, Information and Child Protection
Child Poverty: Experiencing deprivation in two or more dimensions
Extreme Child Poverty: Experiencing extreme deprivation in two or more dimensions
Poverty affects children differently than adults. When a child falls into poverty it can last a lifetime.
Income is not the best way of measuring child poverty; there are many deprivations children experience which income does not capture.
Child Poverty in Uganda is at 55% for under-fives, and 38% for 6–17-year-olds. These figures capture children experiencing 2 or more deprivations.
4.0 swot-analysis
Strengths
•
|
Weaknesses
SRHR, OVC and Economic Empowerment interventions and Education and Skilling of AYGW, Men and youth
|
|
Opportunities
Interventions
|
Threats
|
|
4.2 Collaborations
ROCAF collaborates with key stakeholders and agencies: -Rape Hurts Foundation, Wipe Uganda, AOET, Jinja City and district,
Uganda Police, Uganda Prisons, Public and private Health Facilities, Community structures
4.3 Governing Board
| S/NO | NAME | TITLE | SEX | AFFILIATION | ADDRESS &
TEL. CONTACT |
YEARS
ON BOARD |
| 1 | Hon. Sophie
Nangendo |
C/person | F | C.E.O Ngendo stationaries | +256776711140
Jinja city, Uganda |
1 |
| 2 | Ms. Kazige Racheal | Vice C/person | F | Student Kampala University | Buwenge, jinja Uganda +256755724324 | 2 |
| 3 | Mr. Basimbe Grace
Micheal |
General Secretary | M | In-charge Victoria clinic- Jinja city | Mafubira, jinja city
Uganda +256751653710
|
6 |
| 4 | Ms. Adikini Caroline | Treasurer | F
|
Motor engil LTD | Tororo, Uganda
+256701996750
|
4 |
| 5 | Mr. Were Edward | Coordinator | M | Jinja District Local Government | Wanyange, Jinja city, Uganda
+256702730395
|
2 |
| 6 | Ms. Antonyuka
Nadia |
Member | F | City Prosecutor’s Office-Ukraine | Ukraine
+256709933700 |
1 |
| 7 | Ms. Tifana Sarah | Member | F
|
Probation Office jinja District | Walukuba jinja city
Uganda +256754955683
|
1 |
| 8 | Mr. Kanabiro Robert | Executive Director | M | Business man in Jinja | Buwenge, Jinja District | 6 |
5.0 Thematic Program Areas.
THEMATIC AREA 1: HIV/AIDS
SO5.1To mitigate the spread of HIV/AIDS and offer comprehensive care and support to individuals impacted by the virus in greater Jinja, with a focus on AGYWs, men, and youths.
ACTIVITIES
5.1.1 Conduct 80 AGYW and youth-friendly HCT outreaches to 10000 in and out of school youths and AGYWs.
5.1.2 Conduct 50 HCT Outreaches targeting 5000 individuals HIV Hot spots and socializing places (bars, Disco halls, social events-Ekitudha)
5.1.3 Index HIV client testing
5.1.4 Assisted Partner Notification (APN)
5.1.5 Install 500 condom dispensers in 500 socializing places/HIV Hot spots
5.1.6 Collaborate with Public facilities to distribute and Refill Dispensers in socializing places (Bars, Guest houses with Condoms
5.1.7 Re Orientation of VHTs and Community structures (including) CSW, peers of
KPs on Basics in HIV (Literacy Education)
5.1.7 Coordination: Engage Parish Task Forces and Sub- County Task forces on HIV/AIDs
5.1.8 Re Orientation/Training of Testers in Sub- County private and public health facilities on HIV Testing
5.1.9 Conduct home visits and provide ART adherence psychosocial support to 500 PLHIV.
5.1.10 Strengthen PLHIV Nets works in villages & peer to peer PSS Offer economic empowerment programs to 200 PLHIV and their families.
SO, 5.2 Raise awareness on HIV prevention care and treatment among youths, Men and Women
ACTIVITIES
5.2.1 Organize workshops, seminars, and training sessions on HIV prevention, care, and treatment.
5.2.2 Conduct HIV awareness campaigns targeting 50000 youths, men, and women through social media, schools, and community events.
5.2.3 Radio talk Shows on HIV/AIDS prevention, care and Treatment and stigma
5.2.4 Implement anti-stigma campaigns through social media and community events
5.2.5 Develop and distribute youth-focused HIV/AIDS information materials (e.g., brochures, posters).
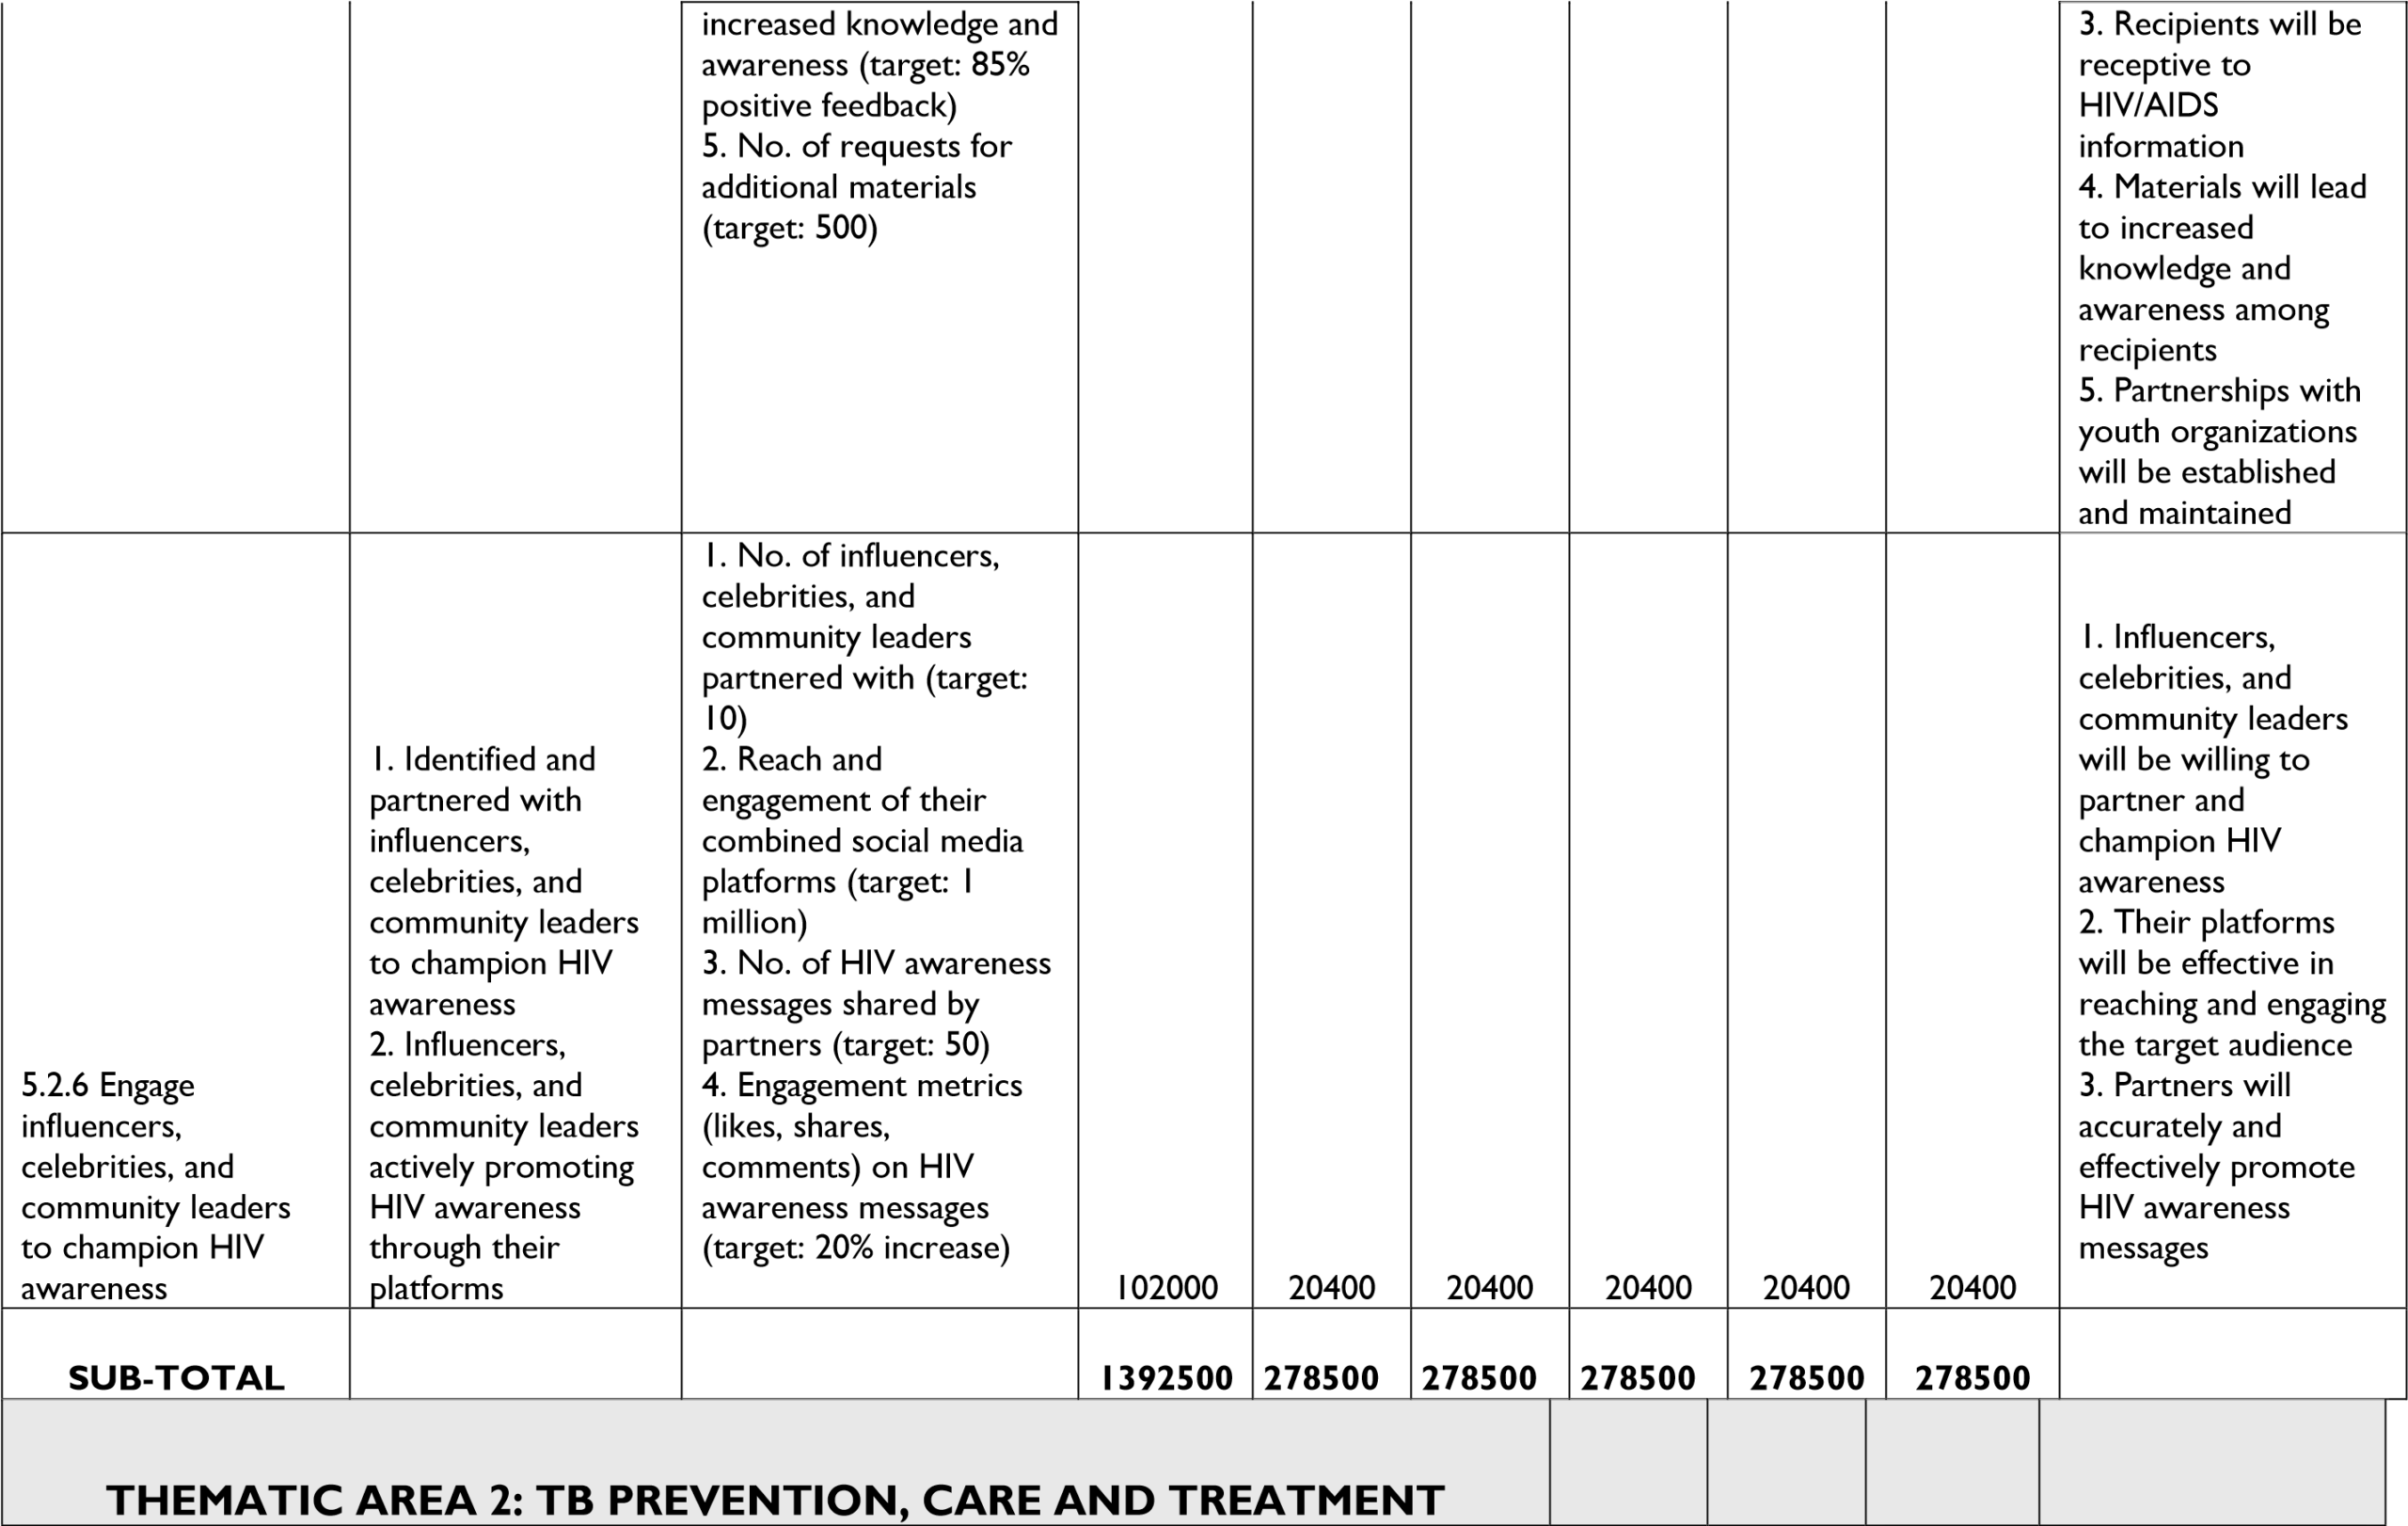
5.2.6 Engage influencers, celebrities, and community leaders to champion HIV awareness.
THEMATIC AREA 2: TB PREVENTION, CARE AND TREATMENT
SO5.3 To Create Awareness about Tb and contribute to increased proportion of people with Tb symptoms that seek appropriate care from health facilities
ACTIVITIES
5.3.1 Conduct 75 community-based sensitization sessions for 3750 community/institutional leaders on TB prevention, control, and stigma reduction in 15 selected sub-counties/divisions of greater jinja.
5.3.2 Collaborate with 10 public health facilities and 5 CSOs to implement the CAST+ Campaign screening, and sputum collection.
SO5.4 To conduct Tb contact tracing to index Tb patients and contribute to increased Tb preventive therapy (TPT) uptake among eligible Contacts under 5 and 5+ yrs.
ACTIVITIES
5.4.1: Implement Tb Contact tracing and TPT Initiation
5.4.2: Conduct quarterly Training sessions for 10 ROCAF staffs and 20 volunteers on Integrated TB/Leprosy Management (ICTLM) and contact tracing.
SO5.5 To Strengthen Public Private Mix (PPM) for TB
ACTIVITIES
5.5.1 Train 250 Health Workers in private Health facilities on Public private Mix (PPM)
5.5.2 Equip 15 Private clinics with HMIS tools, ICF, Sputum mugs and Gene X-pert
Request forms
5.5.3 Supportive supervision and mentorship to 20 clinics in PPM
THEMATIC AREA3: MALARIA:
SO5.6 To contribute to reduced Malaria infections and Zero deaths in greater Jinja
ACTIVITIES;
5.6.1Engagement of 1000 community stakeholders (Education sectors, Works Dept, Agricultural sector, informal sector e.g. brick making sector, LCs, Religious leaders) in the sub-counties of Jinja on Malaria prevention
5.6.2 Conduct Integrated Outreaches in collaboration with public Health facilities on Malaria Test and Treatment in 100 Villages with highest Malaria cases
5.6.3 Train 100 Village Health Teams (VHTs) and 50 Health Assistants on Integrated Community Case Management (ICCM) of malaria diagnosis, treatment, and prevention community in Selected sub counties with high Malaria burden
5.6.4 Facilitate 100 VHT to do House hold Community Identification of Children under Five with Fever, and Refer to health facility.
5.6.5 Map 100 Villages with highest Malaria cases, and Conduct sensitization campaigns on malaria prevention (Malaria GO Campaign) in these villages to Change Mind sets of communities.
5.6.6 Conduct house-to-house assessments and Engage 1000 households in improving their homesteads, Identify and remove breeding places for mosquitoes to prevent malaria.
5.6.7 Re-orient 100 parish and sub-county leaders to establish task forces to coordinate malaria activities and monitor progress on malaria prevention and control.
5.6.8 Conduct Assessment of 5000 Homes for Malaria free House (SMART Homes)
5.6.8 Conduct 560 weekly Radio Talk shows on Malaria
5.6.9 Conduct trainings to 200 Health workers and other players on Mass Action
Against Malaria (MAAM) & House hold Action Against Malaria (HAAM)
SO5.7 To strengthen integrated Case Management of Malaria in health Facilities
ACTIVITIES;
5.7.1 Capacity building of a multi-disciplinary team at 50 private and 30 public facilities
(Clinicians, Mid wives, Laboratory, vector control, Logistics Teams, Health Inspectors) on Integrated Case management of Malaria
5.7.2 Support supervision and Mentorship of 80 Health Facilities on Malaria Management practices (Diagnosis, Treatment, Prevention, Data management and reporting).
THEMATIC AREA: 4 WASH/NUTRITION
SO, 5.8 Improve access to safe water, sanitation, and hygiene (WASH) facilities and promote good nutrition practices among vulnerable populations, particularly children and women.
ACTIVITIES;
5.8.1 Conduct Community HH WASH/Nutrition Assessment (MUAC) for 2500 Children, 500 Pregnant Women in 5000 HHs
5.8.2 Linkage of 500 MAM & SAM to Health Centers for Out-patient Treatment centers (OTC) and In-patient Treatment Centers (ITC).
5.8.3 Implement nutrition education and counseling program in 15 sub-counties/ divisions
5.8.4 Conduct Pre trigger and Trigger sessions on sanitation Improvement in 40 villages and follow up of HHs with um improved and no Latrines for Sanitation Improvement
5.8.5 Rehabilitate 500 latrines and promote proper waste disposal
5.8.6 Conduct hygiene promotion campaigns in 15 sub-counties/divisions of greater jinja.
5.8.7 Distribute hygiene materials (soap, toothbrushes, etc.) 500 vulnerable households.
5.8.8 Establish handwashing stations and promote handwashing practices in 200 Trading centres of villages in jinja.
5.8.9 Inspection of Water Sources and Capacity building of 100 Water and Sanitation Committees
5.8.10 Rehabilitate 100 boreholes, wells, and water storage facilities.
5.8.11 Install 100 water treatment systems and distribute water purification tablets 5000 households
5.8.12 Conduct annual Training workshops for 50 Jinja DWSCC members on WASH Governance
5.8.13 Support Quarterly meeting with 50 DWSCC members, including district/City officials, NGOs, and community representatives.
THEMATIC AREA 5: GENDER-BASED VIOLENCE
SO5.9 Improve and increase the accessibility by 30% for victims to essential, specialist, safe and adequate multisectoral services.
ACTIVITIES
5.9.1 Provide training to 250 multi-sectoral service providers on victim-centered care, traumainformed approach and multi-sectoral collaboration.
5.9.2 Establish and run a one-stop crisis Centre for victims of GBV that can avail 50 victims per day with Holistic services and 24/7 under one roof.
5.9.3 Do Quarterly awareness raising campaigns to Educate victims, communities, and service providers about available services and how to access them.
5.9.4 Conduct Bi annual stakeholder’s meetings with service providers, government agencies, and community organizations to ensure a coordinated response.
5.9.5 Do service mapping by Creating and disseminating 10000 copies of a directory of available services, including specialist services, to victims and service providers.
SO5.10: Enhance an Improved prevention of GBV through changes in behavior, practices and attitudes.
ACTIVITIES;
5.10.1 Behavior change programs targeting 1000 men and boys to transform harmful gender norms and behaviors
5.10.2 Organize Quarterly community events, campaigns, and dialogues to raise awareness about GBV.
5.10.3 Engage 225 Community, religious and traditional leaders to promote GBV prevention and support survivors in promoting non-violence and gender equality.
5.10.4 Integrate GBV prevention into school curricula and extracurricular activities in 100 primary schools.
5.10.5 Conduct 180 radio talk to challenge harmful gender stereotypes and promote positive attitudes.
THEMATIC AREA6: SOCIO-ECONOMIC EMPOWERMENT
SO5.11 To contribute to poverty reduction by Fostering socio-economic resilience and sustainable livelihoods among vulnerable populations.
ACTIVITIES;
5.11 .1 Vocational skills training (Carpentry, Tailoring, Hair dressing, Soap making and metal fabrication) to 250 AGYW, youth, OVC and their households.
5.11.2 Entrepreneurship and business skills training to 500 AGYW, Youths and OVCs
5.11.3 Establish the trained individuals into 5 groups basing on their respective training and then provide these groups with respective start-up kits.
5.11.4 Life skills training for 500 AGYW, youths and OVCs
5.11.5 Computer literacy and digital skills training to 250 AGYW, and Youths
THEMATIC AREA 7: ENVIRONMENT AND CLIMATE CHANGE
SO5.12 Strengthen Environmental protection and uptake of Climate resilience/protection Technologies in 50 Schools and 50 health facilities in response to Climate Change.
ACTIVITIES;
5.12.1 Planting Trees and Grass on 50 school and 50 health facility compounds
5.12.2 Installation of Clean Energy Cooking technology (Solar, biogas) in 20 high volume boarding primary and secondary schools
5.12.3 Training of 250 teachers, SMC, PTA, HUMC, health workers, Environmental officers on Climate change resilience
5.12.4 Installation of Lighting rods/conductors on 50 Health facilities and 50 Schools 5.12.5 Annual Climate change education and awareness campaigns
THEMATIC AREA 8: EDUCATION FOR WOMEN, YOUTHS, AND CHILDREN
SO5.13: Improve the quality, accessibility, and inclusivity of education for 2500 disadvantaged groups by 2028 through capacity-building for educators, fostering youth leadership in extracurricular activities, and promoting gender equality in the learning environment.
ACTIVITIES;
5.13.1 Construct or rehabilitate a school in targeted area.
5.13.2 Mobilize scholastic materials, uniforms, sanitary pads and School fees for 500 disadvantaged students.
5.13.3 Conduct biannual training workshops for 100 teachers on modern pedagogy and childcentered learning
5.13.4 Conduct 20 quarterly awareness campaigns and events to raise awareness about the importance of girls’ education and women’s empowerment. among community members.
5.13.5 Distribute 10,000 IEC materials to raise awareness about the importance of girls’ education and women’s empowerment among community members.
5.13.6 Provide Accessible infrastructure like wheelchair, wide doors, handrails etc. in 50 schools for students with disabilities.
5.13.7 Establish and support 50 school clubs and youth-led initiatives.
5.13.8 Organize sports and cultural activities to promote teamwork, discipline, and a sense of community in 50 schools.
THEMATIC AREA 9: ORPHANS AND VULNERABLE CHILDREN IN GREATER JINJA.
SO5.14: Contribute to the reduction in child poverty and deprivation through comprehensive prevention and response programs.
ACTIVITIES;
5.14.1: Identify and register 1000 OVCs.
5.14.2: Support access to business financial services for 250 OVC households through microfinance agencies.
5.14.3: Facilitate access to market information for 500 OVC households to help them sell their products.
5.14.4: Provide social assistance to 500 OVC households to address hunger and malnutrition. Develop and implement early childhood development programs to 500 OVCs
5.14.5: Provide high quality agricultural inputs/tools, seeds/plantings and stocking materials to 500 OVC households. Provide economic empowerment opportunities for caregivers
5.14.6: Establish and train 100 VHT and encourage them to make OVC a key priority and target group.
5.14.7: Provide appropriate assistive devices, (based on assessed needs) to 50 OVC with special needs
5.14.8 Provide Psychosocial, Child Protection and Legal Support to 1000 OVC.
THEMATIC AREA 10: ROMIC MEDICAL CENTRE.
SO5.15. To provide accessible and affordable medical care services to vulnerable communities, improving their overall health and well-being.
ACTIVITIES;
5.15.1. General Medical Services:
-
-
-
- Provide outpatient consultations and treatment 50 vulnerable people per day for common illnesses and chronic conditions
- Offer maternal and child health services, including antenatal and postnatal care to 10 people per day.
-
-
5.15.2. Medicolegal Services:
-
-
-
- Provide medical examination and documentation to 20 survivors per day for legal purposes (e.g., court cases, insurance claims)
- Offer counseling and support services for 20 survivors per day of gender-based violence and other forms of abuse
-
-
5.15.3. Laboratory Services:
-
-
-
- Conduct diagnostic tests and examinations (e.g., blood tests, urinalysis, stool tests) for 50 vulnerable people per day.
- Provide results interpretation and recommendations to 50 individuals per day for further treatment
-
-
5.15.4. Community Outreach and Engagement:
-
-
-
- Organize quarterly health fairs and outreach programs to raise awareness about available services
- Engage with 50 local leaders and 50 community groups to promote the medical Centre and its services
-
-
5.15.5. Capacity Building and Quality Improvement:
-
-
-
- Provide training and capacity-building programs for 15 and medical staff
- Conduct monthly quality assurance and improvement activities to ensure high standards of car
-
-
| TOTAL
BUDGE T (‘000) |
TIME FRAME/ YRS (INCLUDE AMOUNTS) |
ASSUMPTIONS |
||||||||
| 6.0 Monitoring | and Evaluation Ac | tivities |
|
|||||||
| 2025
(‘000) |
2026 (‘000) |
2027
(‘000) |
2028
(‘000) |
2029
(‘000) |
||||||
| ACTIVITY
DESCRIPTION
|
OUT-PUT
|
PERFORMANCE INDICATORS | ||||||||
| THEMATIC AREA 1: HIV/AIDS.
|
||||||||||
| SO 5.1: To mitigate the spread of HIV/AIDS and offer comprehensive care and support to individuals impacted by the virus in greater Jinja, with a focus on AGYWs, men, and youths
|
||||||||||
| 5.1.1Conduct 80 AGYW and youthfriendly HCT outreaches to 10000 in and out of school youths and AGYWs | -80 outreaches conducted to Key and priority population
-10,000 in and out of school youths and AGYWs reached with HIV testing and counseling services |
–
1. No of outreaches conducted (target: 80) 2. No. of youths and AGYWs reached with HCT services (target: 10,000)
HIV
AGYWs counseled on HIV prevention and risk reduction
services
identified |
200000 | 40000 | 40000 | 40000 | 40000 | 40000 | The outreaches will be conducted in areas with high HIV prevalence and limited access to HCT services.
Collaborations with local schools, community leaders, and youth organizations will facilitate outreach activities. Community leaders and members will be engaged to promote the outreaches and encourage participation. Accurate data will be collected and reported to monitor |
|
| 8. Percentage of youths
and AGYWs who know their HIV status. |
progress and evaluate the effectiveness of the outreaches.
|
||||||||
| 5.1.2Conduct 50 HCT Outreaches targeting 5000 individuals HIV Hot spots and socializing places (bars ,Dicso halls, Social eventsEkitudha) | – 50 HCT outreaches conducted in HIV hotspots and socializing places – 5,000 individuals reached with HCT
services |
(target: 50)
services (target: 5,000) 3. No. of individuals counseled on HIV prevention and risk reduction (target: 4,500) 4. No. of individuals referred to care and treatment services (target: 250)
90%)
|
125000 | 25000 | 25000 | 25000 | 25000 | 25000 | |
| 5.1.3 Index HIV client testing to 250 |
|
(target: 250)
|
9500 | 1900 | 1900 | 1900 | 1900 | 1900 |
(target: 95%)
|
|||||||||
| 5.1.4Assisted Partner
Notification (APN) |
50 index clients received APN services
– partners notified and tested for HIV – partners linked to care and treatment services |
APN services (target: 80%)
5. Time from index client testing to partner notification (target: <30 days) |
5000 | 1000 | 1000 | 1000 | 1000 | 1000 |
HIV testing
be available to conduct APN activities
|
| 5.1.5Install 500 condom dispensers in
500 socializing places/HIV Hot spots |
-500 condom
dispensers installed in socializing places/HIV hotspots -Increased accessibility and availability of condoms in targeted areas |
|
73000 | 14600 | 14600 | 14600 | 14600 | 14600 |
will allow installation of condom dispensers
|
| 5.1.6 Collaborate with Public facilities to distribute and Refill Dispensers in socializing places (Bars, Guest houses with Condoms | -Established partnerships with public facilities for condom distribution and dispenser
refilling -Condoms distributed to socializing places through public facilities -Regular refilling of condom dispensers in socializing places
|
1 No. of public facilities partnered with for condom distribution and
dispenser refilling (target: 50) 2. No. of socializing places (Bars, Guest houses) receiving condoms through public facilities (target: 200) |
90000 | 18000 | 18000 | 18000 | 18000 | 18000 |
1. Public facilities will agree to partner with the project for condom distribution and dispenser refilling
|
| 5.1.7 Re Orientation
of VHTs and Community structures (including) CSW, peers of KPs on Basics in HIV (Literacy Education) |
-Re-oriented VHTs
(Village Health Teams) on basics of HIV literacy education -Re-oriented community structures (CSWs, peers of KPs) on basics of HIV literacy education -Improved knowledge and understanding of HIV basics among VHTs and community structures |
200)
|
171000 | 34200 | 34200 | 34200 | 34200 | 34200 |
structures will be available and willing to participate in reorientation
available and adequate
structures will retain knowledge and apply it in their work
education will lead to improved HIV prevention and care practices |
| 5.1.8Coordination: Engage Parish Task
Forces and Sub- County Task forces on HIV/Aids |
– Parish Task Forces and Sub-County Task Forces engaged and active in HIV/AIDS response – Improved coordination and collaboration among stakeholders at parish and subcounty levels – Enhanced response to HIV/AIDS at parish
and sub-county levels |
Forces and Sub-County Task Forces engaged (target: 50)
quarterly)
(target: 20) |
52000 | 10400 | 10400 | 10400 | 10400 | 10400 |
activities
|
| 5.1.9ReOrientation/T raining of Testers in Sub- County private and public health facilities on HIV
Testing |
– Testers in SubCounty private and public health
facilities re- oriented/trained on HIV testing – Improved knowledge and skills of testers on HIV testing procedures and protocols – Enhanced quality of HIV testing services in SubCounty health facilities |
41000 | 8200 | 8200 | 8200 | 8200 | 8200 | 1. No. of testers reoriented/trained (target: 200) 2. Pre- and posttraining assessments showing increased knowledge and skills (target: 80% increase) 3. Observed practice
of testers demonstrating correct HIV testing procedures (target: 90% correct practice)
|
|
| 5.1.10Conduct home visits and provide | – 500 PLHIV receive home visits and | 1. No. of PLHIV receiving home visits and | 55000 | 11000 | 11000 | 11000 | 11000 | 11000 | 1. PLHIV will be willing to receive |
| ART adherence psychosocial support to 500 PLHIV. | ART adherence psychosocial support
– Improved ART adherence among PLHIV – Enhanced psychosocial wellbeing among PLHIV |
ART adherence psychosocial support
(target: 500) 2. Percentage of PLHIV with improved ART adherence (target: 80%) 3. Percentage of PLHIV reporting improved psychosocial well-being (target: 85%)
among PLHIV with home visits and psychosocial support (target: 90%) |
home visits and psychosocial support 2. Trained counselors will be available to conduct home visits and provide support
3. Resources (transportation, materials, etc.) will be available to support home visits 4. PLHIV will have access to ART and other necessary treatment and care services 5. Home visits and psychosocial support will lead to improved ART adherence and psychosocial wellbeing. |
||||||
| 5.1.11Strengthen
PLHIV Nets works in villages & peer to peer PSS Offer economic empowerment programs to 200 PLHIV and their families. |
PLHIV networks in villages
their families receive economic empowerment programs |
1. No. of PLHIV networks strengthened in villages (target: 20) 2. No. of PLHIV receiving peer-to-peer PSS (target: 500) 3. No. of PLHIV and
their families receiving economic empowerment programs (target: 200) 4. Increase in income among PLHIV and their families (target: 20%) 5. Improvement in food security among PLHIV and their families (target: 25% |
63000 | 12600 | 12600 | 12600 | 12600 | 12600 | 1. PLHIV will be willing to participate in networks and peer-to-peer PSS 2. Trained peer mentors will be available to provide
PSS
programs will be effective in improving income and food security
|
| resources and support
5. Strengthened networks and peerto-peer PSS will lead to improved wellbeing and economic empowerment |
|||||||||
| SO 5.2 Raise awareness on HIV prevention care and treatment among youths, Men and Women
|
|||||||||
| 5.2.1Organize workshops, seminars, and training sessions on HIV prevention, care, and treatment. |
|
(target: 10)
4. Evaluation forms from participants indicating improved skills and capacity (target: 85% positive feedback) 5. No. of healthcare providers and community workers applying new skills and knowledge (target: 90%) |
105000 | 21000 | 21000 | 21000 | 21000 | 21000 |
apply new skills and knowledge 5. Workshops, seminars, and training sessions will lead to improved HIV prevention, care, and treatment practices |
| 5.2.2 Conduct HIV awareness campaigns targeting 50000 youths, men, and women through
social media, schools, |
1. Conducted HIV awareness campaigns targeting 50,000 youths, men, and women |
|
81000 | 16200 | 16200 | 16200 | 16200 | 16200 |
|
| and community events. | 2. Increased knowledge and awareness about HIV prevention, care, and treatment among the target audience 3. Improved attitudes and behaviors towards HIV and PLHIV among the target audience |
|
and community events will be effective channels for reaching the target audience
3. Resources (materials, personnel, etc.) will be available to support campaigns 4. Campaigns will lead to improved knowledge, attitudes, and behaviors towards HIV and PLHIV 5. Partnerships with schools and community organizations will be established and maintained |
||||||
| 5.2.3: 60 Radio talk Shows on HIV/AIDS prevention, care and Treatment and stigma |
through radio talk shows
among radio listeners |
shows conducted (target:60)
listeners indicating increased knowledge and awareness (target: 80% positive feedback) 4. Reduction in stigma and discrimination against PLHIV (target: 20% reduction) 5. No. of calls and messages received during radio talk shows (target: 500) |
70000 | 14000 | 14000 | 14000 | 14000 | 14000 |
support radio talk shows 4. Radio talk shows will lead to improved knowledge, attitudes, and behaviors towards HIV/AIDS |
| 5. Stigma and
discrimination against PLHIV will be addressed through radio talk shows |
|||||||||
| 5.2.4 Implement Quarterly anti-stigma campaigns through social media and community events | 1. Implemented quarterly anti-stigma campaigns through social media and community events 2. Reduced stigma and discrimination
against PLHIV in the community 3. Increased awareness and understanding of HIV/AIDS among community members |
(target: 10,000 engagements per quarter)
5. Reduction in stigma and discrimination against PLHIV (target: 15% reduction per quarter) |
100000 | 20000 | 20000 | 20000 | 20000 | 20000 |
(materials, personnel, etc.) will be available to support campaigns 3. Community leaders and members will be receptive to anti-stigma messages 4. Campaigns will lead to reduced stigma and increased awareness 5. Partnerships with community organizations will be established and maintained |
| 5.2.5 Develop and distribute youthfocused HIV/AIDS information materials (e.g., brochures, posters) to 10000 individuals | 1. Developed youthfocused HIV/AIDS information materials
(brochures, posters) 2. Distributed materials to 10,000 individuals |
1. No. of materials developed (target: 5 types of materials) 2. No. of materials distributed (target:
10,000) 3. Reach and coverage of materials (target: 80% of target audience) 4. Feedback from recipients indicating |
50000 | 10000 | 10000 | 10000 | 10000 | 10000 |
1. Youth-focused materials will be effective in engaging and informing the target audience 2. Materials will be accurately and effectively distributed to the target audience |
| SO5.3 To Create Awareness about Tb and contribute to increased proportion of people with Tb symptoms that seek appropriate care from health facilities
|
|||||||||
| 5.3.1 Conduct 75 community-based sensitization
sessions for 3750community/inst itutional leaders on TB prevention, control, and stigma reduction in 15 selected subcounties/divisions of greater jinja. |
1. Conducted 75 community-based sensitization sessions on TB prevention, control, and stigma reduction 2. 3750 community/instituti onal leaders sensitized on TB prevention, control, and stigma reduction |
1. No. of sensitization sessions conducted (target: 75) 2. No. of community/institutional leaders sensitized (target: 3750) 3. Pre- and postsensitization assessments showing increased knowledge and awareness (target: 80% increase)
|
110000 | 22000 | 22000 | 22000 | 22000 | 22000 |
1. Community/institutio nal leaders will be willing to participate in sensitization sessions
awareness
(facilitators, materials, etc.) will be available to support sensitization sessions |
| 5.3.2 Collaborate with 10 public health facilities and
5 CSOs to implement the CAST+ Campaign screening, and sputum collection |
1. Collaborated with 10 public health facilities and 5 CSOs to implement the
CAST+ Campaign 2. Conducted screening and sputum collection for TB diagnosis |
15)
|
140000 | 28000 | 28000 | 28000 | 28000 | 28000 |
|
| 3. No. of sputum samples collected (target: 5,000) 4. No. of TB cases detected and referred for treatment (target:
500) 5. Feedback from partners indicating improved TB diagnosis and treatment (target: 90% positive feedback) |
be available to support screening and sputum collection
3. Individuals will be willing to participate in screening and sputum collection 4. Screening and sputum collection will lead to improved TB diagnosis and treatment 5. Partners will accurately and effectively implement the CAST+ Campaign |
||||||||
| SO5.4 To conduct Tb contact tracing to index Tb patients and contribute to increased Tb preventive therapy (TPT) uptake among eligible Contacts under 5 and 5+ yrs. | |||||||||
| 5.4.1: Implement Tb Contact tracing and TPT Initiation | 1. Implemented TB contact tracing 2. Initiated
Tuberculosis Preventive Treatment (TPT) for eligible contacts |
(target: 90%)
5)
80%)
|
125000 | 25000 | 25000 | 25000
25000 |
25000 | 1. TB patients will provide accurate contact information 2. Contacts will be willing to participate in tracing and TPT initiation 3. Resources (personnel, equipment, etc.) will be available to support contact
tracing and TPT initiation 4. Healthcare workers will be trained and skilled in contact tracing and TPT initiation |
|
| 5. TPT will be effective in preventing TB transmission among contacts | |||||||||
| 5.4.2: Conduct quarterly Training sessions for 10 ROCAF staffs and
20 volunteers on Integrated TB/Leprosy Management ICTLM and contact tracing.
|
1. Conducted
quarterly training sessions for ROCAF staff and volunteers on ICTLM and contact tracing 2. Increased knowledge and skills of ROCAF staff and volunteers on ICTLM and contact tracing |
(target: 4)
|
44000 | 8800 | 8800 | 8800 | 8800 | 8800 | 1. ROCAF staff and volunteers will be willing to participate in training sessions 2. Training sessions will be effective in increasing knowledge and skills
(facilitators, materials, etc.) will be available to support training sessions
and skills in their work
|
| SO5.5 To Strengthen Public Private Mix (PPM) for TB | |||||||||
| 5.5.1 Train 250 Health Workers in private Health facilities on PPM | 1. Trained 250 Health Workers in private Health facilities on PPM 2. Increased knowledge and skills of Health Workers on PPM |
Workers trained (target: 250)
participants indicating improved understanding |
54000 | 10800 | 10800 | 10800 | 10800 | 10800 |
1. Health Workers will be willing to participate in training 2. Training will be effective in increasing knowledge and skills 3. Resources (facilitators, materials, etc.) will |
| of PPM (target: 90% positive feedback)
4. No. of private Health facilities implementing PPM (target: 80%) 5. Increase in TB case notification from private Health facilities (target: 20%) |
be available to support training 4. Health Workers will apply new knowledge and skills in their work 5. Private Health facilities will be
willing to implement PPM |
||||||||
| 5.5.2 Equip 15
Private clinics with HMIS tools, ICF, Sputum mugs and Gene X-pert Request forms |
1. Equipped 15
Private clinics with:
Request forms 2. Improved data collection and reporting capacity in Private clinics |
(target: 15)
(target: 150)
(target: 90%)
95% accuracy)
|
45000 | 9000 | 9000 | 9000 | 9000 | 9000 |
1. Private clinics will be willing to accept and use HMIS tools and materials 2. HMIS tools and materials will be effective in improving data collection and reporting
etc.) will be available to support distribution and training
to use HMIS tools
timely and accurate manner |
| 5.5.3 Supportive supervision and mentorship to 20 clinics in PPM |
1. Provided supportive supervision and |
1. No. of clinics receiving supportive supervision and mentorship (target: 20) |
62000 | 12400 | 12400 | 12400 | 12400 | 12400 | 1. Clinics will be receptive to supportive supervision and mentorship |
| mentorship to 20 clinics in PPM
2. Improved quality of TB/HIV services in PPM clinics |
5. Increase in TB/HIV case notification from PPM clinics (target: 15%) |
etc.) will be available to support supervision and mentorship
|
|||||||
| SUB-TOTAL | 580000 | 116000 | 116000 | 116000 | 116000 | 116000 | |||
| THEMATIC AREA3: MALARIA
|
|||||||||
| SO5.6 To contribute to reduced Malaria infections and Zero deaths in greater Jinja
|
|||||||||
| 5.6.1Engagement of 1000 community stakeholders in the sub-counties of Jinja
on Malaria prevention |
1. Engaged 1000 community
stakeholders in Jinja sub-counties on Malaria prevention 2. Increased awareness and knowledge of Malaria prevention |
|
81000 | 16200 | 16200 | 16200 | 16200 | 16200 |
willing to participate in engagement activities
activities will be effective in increasing |
| methods among community stakeholders |
(target: 20%)
|
awareness and knowledge
3. Resources (personnel, materials, etc.) will be available to support engagement activities 4. Community stakeholders will have access to Malaria prevention methods 5. Engagement activities will lead to behavior change and reduction in Malaria cases |
|||||||
| 5.6.2 Conduct Integrated Outreaches in collaboration with public Health facilities on Malaria Test and Treatment in 100 Villages with highest Malaria cases |
Integrated Outreaches in 100 villages with highest Malaria cases
public health facilities |
1. No. of villages reached with Integrated Outreaches (target: 100) 2. No. of individuals tested for Malaria (target: 10,000)
(target: 25%) 5. Feedback from villagers indicating improved access to Malaria services (target: 90% positive feedback) |
350000 | 70000 | 70000 | 70000 | 70000 | 70000 |
collaborate and provide support for Integrated Outreaches
Outreaches |
| 5.6.4 Train 100
VHTs and 50 Health Assistants on ICCM of malaria diagnosis, |
1. Trained 100
VHTs and 50 Health Assistants on ICCM of malaria |
1. No. of VHTs and
Health Assistants trained (target: 150) |
54000 | 10800 | 10800 | 10800 | 10800 | 10800 | 1. VHTs and Health Assistants will be willing to participate in training |
| treatment, and prevention community in Selected sub counties with high Malaria burden | 2. Improved knowledge and skills of VHTs and Health Assistants on malaria diagnosis, treatment, and prevention |
(target: 90% positive feedback)
Health Assistants (target: 25%)
on malaria prevention (target: 20%)
|
(facilitators, materials, etc.) will be available to support training 4. VHTs and Health Assistants will apply new knowledge and skills in their work 5. Training will lead to improved malaria diagnosis, treatment, and prevention practices in the community |
||||||
| 5.6.4 Facilitate 100
VHT to do House hold Community Identification of Children under Five with Fever, and Refer to health facility. |
1. Facilitated 100 VHTs to conduct household community
identification of children under five with fever 2. Referred identified children to health facilities for appropriate treatment |
100)
5,000)
(target: 1,500) 4. No. of children referred to health facilities (target: 1,200) 5. Increase in timely and appropriate treatment of children with fever (target: 30%) |
39000 | 7800 | 7800 | 7800 | 7800 | 7800 |
conduct household visits
receptive to VHT visits and identification of children with fever 3. Resources (transportation, communication, etc.) will be available to support VHTs 4. Health facilities will be able to receive and treat referred children |
| 5. VHTs will accurately identify children with fever
and refer them to health facilities |
|||||||||
| 5.6.5 Map 100
Villages with highest Malaria cases, and Conduct sensitization campaigns on malaria prevention (Malaria GO Campaign) in these villages to Change Mind sets of communities |
1. Mapped 100 villages with highest
Malaria cases 2. Conducted sensitization campaigns on malaria prevention (Malaria GO Campaign) in these villages 3. Changed mindsets of communities on malaria prevention |
1. No. of villages mapped (target: 100) 2. No. of sensitization campaigns conducted
(target: 100)
(target: 10,000)
(target: 25%)
|
135000 | 27000 | 27000 | 27000 | 27000 | 27000 |
1. Accurate data on Malaria cases will be available to identify high-burden villages 2. Communities will be receptive to sensitization campaigns 3. Resources (personnel, materials, etc.) will be available to support campaigns 4. Campaigns will be effective in changing mindsets and behaviors 5. Community leaders and influencers will support and participate in campaigns |
| 5.6.6 Conduct house-to-house assessments and Engage 1000 households in improving their homesteads, Identify and remove breeding places for mosquitoes to prevent malaria. | 1. Conducted house-to-house assessments to identify mosquito breeding places 2. Engaged 1000 households in improving their homesteads to prevent malaria 3. Identified and removed breeding | 1. No. of households assessed (target: 1000) 2. No. of households engaged in improving their homesteads (target: 1000)
3. No. of mosquito breeding places identified and removed (target: 5000) 4. Reduction in mosquito breeding |
150000 | 30000 | 30000 | 30000 | 30000 | 30000 | 1. Households will be willing to participate in assessments and improvements 2. Resources (personnel, equipment, etc.) will be available to support assessments and improvements 3. Households will have the capacity to |
| places for mosquitoes | places in engaged households (target: 80%)
5. Increase in households with improved homesteads to prevent malaria (target: 90%) |
make improvements to their homesteads 4. Removing breeding places will lead to a reduction in
mosquito populations 5. Improved homesteads will lead to a reduction in malaria cases |
|||||||
| 5.6.7 Re-orient 100 parish and subcounty leaders to establish task forces to coordinate malaria activities and monitor progress on malaria prevention and control |
|
1. No. of parish and subcounty leaders reoriented (target: 100) 2. No. of task forces established (target: 100)
3. Increase in coordination and monitoring of malaria activities (target: 80%) 4. Improvement in reporting and documentation of malaria cases (target: 90%) 5. Increase in community engagement and participation in malaria prevention and control (target: 85%) |
130000 | 26000 | 26000 | 26000 | 26000 | 26000 |
5. Leaders will be committed to malaria prevention and control efforts |
| 5.6.8 Conduct
Assessment of 5000 Homes for Malaria free House (SMART Homes) |
|
1. No. of homes assessed (target: 5000) 2. No. of homes meeting
SMART Homes criteria (target: 3000) 3. No. of homes receiving recommendations for |
52000 | 10400 | 10400 | 10400 | 10400 | 10400 |
be willing to participate in assessments
|
| 3. Provided recommendations for homes that do not meet SMART
Homes criteria |
improvement (target:
2000)
SMART Homes (target: 25%)
(target: 15%) |
3. Recommendations will be implemented by homeowners 4. SMART Homes
criteria will be effective in preventing malaria 5. Assessments will lead to increased awareness and knowledge of malaria prevention |
|||||||
| 5.6.8 Conduct 560 weekly Radio Talk shows on Malaria | 1. Conducted 560 weekly Radio Talk shows on Malaria 2. Reached a wide audience with malaria prevention and control message |
shows conducted (target: 560)
1,000,000)
20%)
15%)
listeners indicating improved understanding and behavior change (target: 80% positive feedback) |
570000 | 114000 | 114000 | 114000 | 114000 | 114000 |
and air the talk shows
5. Listeners will be receptive to messages and willing to make behavior changes |
| 5.6.9 Conduct trainings to 200 Health workers and other players on
MAAM & HAAM |
1. Conducted trainings for 200 Health workers and other players on
MAAM and HAAM |
200)
|
73000 | 14600 | 14600 | 14600 | 14600 | 14600 | 1. Health workers and other players will be willing to participate in trainings |
| 2. Improved knowledge and skills of Health workers
and other players on MAAM and HAAM |
MAAM and HAAM
(target: 80%)
25%)
(target: 20%) 5. Feedback from trainees indicating improved confidence and competence (target: 90% positive feedback) |
(facilitators, materials, etc.) will be available to support trainings 4. Trainees will apply new knowledge and skills in their work 5. Trainings will lead to improved malaria case management and outcomes |
|||||||
| SO5.7 To strengthen integrated Case Management of Malaria in health Facilities
|
|||||||||
| 1.5.1 Capacity building of a multidisciplinary team at 50 private and 30 public facilities on Integrated Case management of
Malaria |
1. Capacity building of a multidisciplinary team at 50 private and 30 public facilities on
ICM of Malaria 2. Improved knowledge and skills of healthcare providers on ICM of Malaria |
30%) 4. Increase in referrals for severe malaria cases (target: 25%) 5. Feedback from healthcare providers indicating improved confidence . |
35000 | 7000 | 7000 | 7000 | 7000 | 7000 | 1. Facilities will be willing to participate in capacity building 2. Healthcare providers will be willing to participate in training
(facilitators, materials, etc.) will be available to support training
new knowledge and skills in |
| 1.5.2 Support supervision and Mentorship of 80 |
1. Supported supervision and |
1. No. of Health Facilities receiving | 93000 | 18600 | 18600 | 18600 | 18600 | 18600 |
1. Health Facilities will be willing to |
| Health Facilities on Malaria Management practices. | mentorship of 80
Health Facilities on Malaria Management practices 2. Improved Malaria Management practices in supported Health Facilities |
support supervision and mentorship (target: 80) 2. Increase in correct diagnosis and treatment of malaria cases (target:
25%)
(target: 20%)
Facilities indicating improved capacity and confidence (target: 90% positive feedback) |
receive support supervision and mentorship 2. Resources (personnel, equipment, etc.) will be available to support supervision and mentorship 3. Supervision and mentorship will be effective in improving Malaria Management practices
4. Health Facilities will apply new knowledge and skills in their work 5. Support supervision and mentorship will lead to sustained improvements in Malaria Management practices |
||||||
| SUB-TOTAL | 1762000 | 352400 | 352400 | 352400 | 352400 | 352400 | |||
| THEMATIC AREA 4: WASH/NUTRITION | |||||||||
| 5.7 Improve access to safe water, sanitation, and hygiene (WASH) facilities and promote good nutrition practices among vulnerable populations, particularly children and women.
|
|||||||||
| 5.7.1 Conduct
Community HH WASH/Nutrition Assessment (MUAC) for 2500 Children, 500 |
1. Conducted
Community Household WASH/Nutrition Assessment for 2500 Children and 500 Pregnant |
1. No. of households assessed (target: 5000) 2. No. of children and pregnant women assessed (target: 2500 and 500 respectively) |
104000 | 20800 | 20800 | 20800 | 20800 | 20800 | 1. Households will be willing to participate in assessments 2. Resources (personnel, equipment, etc.) will |
| Pregnant Women in 5000 HHs | Women in 5000
HHs 2. Identified households with poor WASH and nutrition practices 3. Provided recommendations for improvement |
and nutrition practices among households (target: 20%)
(target: 15%) 5. Feedback from households indicating improved understanding and behavior change (target: 85% positive feedback) |
be available to support assessments 3. Assessments will be effective in identifying areas for improvement
4. Households will be receptive to recommendations and willing to make behavior changes 5. Assessments will lead to sustained improvements in WASH and nutrition practices |
||||||
| 5.7.2 Linkage of 500
MAM & SAM to Health Centers for OTC and ITC. |
|
individuals linked to treatment centers (target: 500)
MAM and SAM individuals receiving treatment (target: 90%)
MAM and SAM individuals showing improvement in nutritional status (target: 80%)
individuals requiring hospitalization (target: 20%)
|
94000 | 18800 | 18800 | 18800 | 18800 | 18800 | 1. Health Centers will have capacity to provide treatment
for MAM and SAM individuals 2. Resources (personnel, equipment, etc.) will be available to support treatment 3. MAM and SAM individuals will be willing to access treatment centers 4. Treatment centers will be able to provide quality care and support 5. Linkage to treatment centers will lead to sustained improvements in |
| MAM and SAM cases
(target: 95% positive feedback) |
|||||||||
|
5.7.3 Implement nutrition education and counseling program in 15 subcounties/ divisions |
1. Implemented nutrition education and counseling program in 15 subcounties/divisions 2. Trained community health workers and volunteers on nutrition education and counseling 3. Conducted community outreach and education sessions on nutrition and healthy practices | 1. No. of subcounties/divisions with implemented nutrition education and counseling program (target: 15) 2. No. of community health workers and volunteers trained (target: 300)
(target: 150)
(target: 25%)
(target: 20%) |
99000 | 19800 | 19800 | 19800 | 19800 | 19800 |
(personnel, materials, etc.) will be available to support program implementation 3. Community members will be receptive to nutrition education and counseling 4. Program will lead to sustained improvements in nutrition knowledge and practices 5. Community outreach and education sessions will be effective in reaching target audience |
| 5.7.4 Conduct Pre trigger and Trigger sessions on
sanitation Improvement in 40 villages and follow up of HHs with um improved and No Latrines for |
sanitation improvement in 40 villages
unimproved or no latrines |
(target: 40)
unimproved or no latrines (target: 1000) |
41000 | 8200 | 8200 | 8200 | 8200 | 8200 |
Trigger sessions
(personnel, materials, |
| Sanitation
Improvement |
3. Followed up with households to
support sanitation improvement |
sanitation facilities (target: 800)
positive feedback)
|
etc.) will be available to support follow-up 4. Pre-trigger and Trigger sessions will be effective in motivating behavior change
5. Follow-up will lead to sustained improvements in sanitation practices |
||||||
| 5.7.5 Rehabilitate
500 latrines and promote proper waste disposal |
|
500)
(target: 30%) 4. Reduction in No. of open defecation cases (target: 20%) 5. Feedback from communities indicating improved sanitation and hygiene practices (target: 95% positive feedback) |
644000 | 128800 | 128800 | 128800 | 128800 | 128800 |
(personnel, materials, etc.) will be available to support rehabilitation 3. Proper waste disposal practices will be adopted by communities 4. Rehabilitated latrines will be maintained and used properly
|
| 5.7.6 Conduct hygiene promotion campaigns in 15 sub- | 1. Conducted hygiene promotion campaigns in 15 sub- | 1. No. of subcounties/divisions with conducted hygiene | 127000 | 25400 | 25400 | 25400 | 25400 | 25400 | 1. Community members will be receptive to hygiene messages |
| counties/divisions of greater jinja. | counties/divisions of Greater Jinja
|
promotion campaigns
(target: 15)
(target: 30,000)
(target: 25%)
|
(personnel, materials, etc.) will be available to support campaigns
5. Campaigns will be effective in reaching and engaging target audience |
||||||
| 5.7.7 Distribute hygiene materials (soap, toothbrushes, etc.) 500 vulnerable households. |
|
(target: 500)
100%)
(target: 30%)
(target: 25%)
|
31000 | 6200 | 6200 | 6200 | 6200 | 6200 |
1. Vulnerable households will be identified and targeted effectively 2. Hygiene materials will be available and accessible for distribution 3. Households will use and benefit from the distributed hygiene materials 4. Distribution will lead to sustained improvements in hygiene practices
|
| 5.7.8 Establish handwashing | 1. Established handwashing | 1. No. of trading centers with established | 222000 | 44400 | 44400 | 44400 | 44400 | 44400 |
| stations and promote handwashing practices in 200 Trading centres of villages in jinja. | stations in 200 trading centers of
villages in Jinja 2. Promoted handwashing practices among traders and customers |
handwashing stations
(target: 200)
80%)
|
1. Trading centers will be willing to host handwashing stations 2. Resources
(personnel, materials, etc.) will be available to support establishment and promotion 3. Traders and customers will be receptive to handwashing education and promotion 4. Handwashing stations will be maintained and used properly 5. Promotion will lead to sustained improvements in handwashing practices |
||||||
|
5.7.9 Inspection of Water Sources and Capacity building of 100 Water and Sanitation Committees |
1. Inspected water sources to identify potential contamination risks 2. Capacity building of 100 WSCs on: – Water source
management
|
1. No. of water sources inspected (target: 100) 2. No. of WSCs trained
(target: 100)
(target: 80%)
75%)
|
13200 | 2640 | 2640 | 2640 | 2640 | 2640 | 1. WSCs will be willing to participate in capacity building 2. Resources
(personnel, materials, etc.) will be available to support inspection and training
|
| (target: 90% positive feedback) | contamination risks and inform remedial actions
5. Capacity building will lead to sustained improvements in water and sanitation management |
||||||||
| 5.7.10 Rehabilitate 100 boreholes, wells, and water storage facilities. |
and water storage facilities
|
(target: 100)
85%)
|
500000 | 100000 | 100000 | 100000 | 100000 | 100000 |
1. Communities will be willing to participate in rehabilitation efforts 2. Resources (personnel, materials, etc.) will be available to support rehabilitation
|
| 5.7.11 Install 100 water treatment systems and distribute water purification tablets
5000 households |
|
1. No. of water treatment systems installed (target: 100) 2. No. of households receiving water purification tablets
(target: 5000) 3. Increase in percentage of households with |
140000 | 28000 | 28000 | 28000 | 28000 | 28000 | 1. Communities will be willing to adopt and maintain water treatment systems 2. Households will use water purification tablets correctly and consistently |
| access to safe drinking water (target: 90%) 4. Reduction in No. of reported water-borne diseases (target: 25%) 5. Feedback from households indicating improved access to and satisfaction with safe drinking water (target: 95% positive feedback) |
will be effective in removing contaminants and improving water quality
|
||||||||
| 5.7.12 Conduct annual Training workshops for 50 Jinja DWSCC members on WASH
Governance |
1. Conducted annual training workshops for 50 Jinja DWSCC members on WASH
Governance 2. Improved knowledge and skills of DWSCC members on WASH governance and management |
50)
of DWSCC members with improved knowledge and skills on WASH governance (target: 80%)
management practices among DWSCC members (target: 75%) 4. Feedback from DWSCC members indicating improved confidence and capacity to govern WASH services (target: 90% positive feedback)
|
54000 | 10800 | 10800 | 10800 | 10800 | 10800 |
will be willing to participate in training workshops
(personnel, materials, etc.) will be available to support training 3. Training will lead to sustained improvements in WASH governance and management 4. DWSCC members will apply new knowledge and skills to improve WASH services 5. Training will foster collaboration and coordination among DWSCC members |
| 5.8.13 Support
Quarterly meeting with 50 DWSCC members, including district/City officials, NGOs, and community representatives. |
1. Supported quarterly meetings with 50 DWSCC
members, including district/city officials, NGOs, and community representatives 2. Fostered collaboration and coordination among stakeholders to improve WASH services |
80%)
75%)
stakeholders indicating improved communication and joint problem-solving (target: 90% positive feedback) |
80000 | 16000 | 16000 | 16000 | 16000 | 16000 | 1. Stakeholders will be willing to participate in quarterly meetings 2. Resources
(personnel, materials, etc.) will be available to support meetings 3. Meetings will lead to sustained improvements in WASH service delivery and governance
and skills to improve WASH services
|
| SUB-TOTAL | 2149200 | 429840 | 429840 | 429840 | 429840 | 429840 | |||
| THEMATIC AREA 5: GENDER-BASED VIOLENCE
|
|||||||||
| SO 5:9 Improve and increase the accessibility by 30% for victims to essential, specialist, safe and adequate multisectoral services | |||||||||
| 5.9.1 Provide training to 250 multi-sectoral service providers on victim-centered care, traumainformed approach and multi-sectoral collaboration. | 1. Trained 250 multi-sectoral service providers on:
|
(target: 250)
|
62000 | 12400 | 12400 | 12400 | 12400 | 12400 |
1. Service providers will be willing to participate in training 2. Resources (personnel, materials, etc.) will be available to support training 3. Training will lead to sustained |
| 2. Improved knowledge and skills of service providers to deliver comprehensive and sensitive services | delivered to victims
(target: 80%) 4. Increase in percentage of service providers adopting victim-centered and trauma-informed approaches (target: 90%) 5. Feedback from service providers indicating improved collaboration and coordination (target: 95% positive feedback) |
improvements in service delivery 4. Service providers will apply new knowledge and skills to improve services 5. Training will foster collaboration and coordination among service providers | |||||||
| 5.9.2 Establish and run a one-stop crisis Centre for victims of GBV that can avail 50 victims per day with Holistic services and 24/7 under one roof. |
|
1. No. of victims served per day (target: 50) 2. Range of holistic services offered (target: medical, legal, counseling, shelter, etc.) 3. Percentage of victims reporting satisfaction with services (target:
90%)
|
690000 | 138000 | 138000 | 138000 | 138000 | 138000 |
(personnel, materials, etc.) will be available to support center operations
5. Center will be able to maintain confidentiality and safety for victims |
| 5.9.3 Do Quarterly awareness raising campaigns to Educate victims, communities, and service providers about available | 1. Conducted quarterly awareness-raising campaigns to educate:
|
1. No. of campaigns conducted (target: 4) 2. No. of people reached through campaigns
(target: 10,000) 3. Increase in percentage of victims and |
18000 | 3600 | 3600 | 3600 | 3600 | 3600 |
(personnel, materials, |
| services and how to access them. |
|
communities aware of available services (target:
75%) 4. Increase in percentage of service providers knowledgeable about referral pathways (target: 80%) 5. Feedback from victims, communities, and service providers indicating improved understanding of services and access (target: 90% positive feedback) |
etc.) will be available to support campaigns
|
||||||
| 5.9.4 Conduct Bi annual stakeholder’s meetings with service providers, government
agencies, and community organizations to ensure a coordinated response. |
1. Conducted biannual stakeholder meetings with: – Service providers – Government agencies
|
meetings conducted (target: 2)
(target: 50)
80%)
|
10000 | 2000 | 2000 | 2000 | 2000 | 2000 |
(personnel, materials, etc.) will be available to support meetings 3. Meetings will lead to improved coordination and collaboration
|
| 5.9.5 Do service mapping by Creating and disseminating 10000 copies of a | 1. Created a directory of available services, | 1. No. of directories created and disseminated (target: 10,000) | 10000 | 1. The directory will be accurate and upto-date |
| directory of available services, including specialist services, to victims and service providers. | including specialist services
2. Printed and disseminated 10,000 copies of the directory to: – Victims – Service providers |
75%)
500)
|
|
||||||
| SO5.10: Enhance an Improved prevention of GBV through changes in behavior, practices and attitudes
|
|||||||||
| 5.10.1 Behavior change programs targeting 1000 men and boys to transform harmful gender norms and behaviors | 1. Implemented behavior change programs targeting 1000 men and boys 2. Transformed harmful gender norms and behaviors among participants |
4. Feedback from participants indicating improved understanding of gender equality |
41000 | 8200 | 8200 | 8200 | 8200 | 8200 |
be willing to participate in programs
change |
| (target: 90% positive feedback)
5. Increase in percentage of participants reporting increased support for women’s rights (target: 80%) |
5. Participants will become advocates for gender equality | ||||||||
| 5.10.2 Organize Quarterly community events, campaigns, and dialogues to raise
awareness about GBV |
awareness about GBV
|
1. No. of community events, campaigns, and dialogues held (target: 4) 2. No. of community members participating in events (target: 500)
(target: 75%)
|
13000 | 2600 | 2600 | 2600 | 2600 | 2600 |
in GBV prevention efforts
|
| 5.10.3 Engage 225 Community, religious and traditional leaders to promote GBV prevention and support survivors in |
1. Engaged 225 Community, religious, and traditional leaders to promote GBV prevention |
1. No. of leaders engaged (target: 225) 2. No. of leaders trained on GBV prevention and response (target: 200) 3. Increase in percentage of leaders reporting | 29000 | 5800 | 5800 | 5800 | 5800 | 5800 |
1. Leaders will be willing to engage in GBV prevention efforts |
| promoting nonviolence and gender equality. | 2. Supported survivors in promoting nonviolence and gender equality | increased knowledge and understanding of
GBV (target: 80%)
150)
|
2. Leaders will be receptive to training and capacity-building 3. Leaders will use their influence to promote GBV prevention and support survivors 4. Leaders will be able to reach and engage marginalized or hard-to-reach populations
5. Leaders will be committed to promoting nonviolence and gender equality |
||||||
| 5.10.4 Integrate GBV prevention into school curricula and extracurricular activities in 100 primary schools. | 1. Integrated GBV prevention into school curricula in
100 primary schools 2. Incorporated GBV prevention into extracurricular activities in 100 primary schools |
(target: 30,000)
GBV prevention (target: 500)
|
240000 | 48000 | 48000 | 48000 | 48000 | 48000 |
curricula and extracurricular activities
4. Parents and community members will support GBV prevention efforts in schools
|
| 5.10.5 Conduct 180 radio talk to | Conducted 180 radio talks to | 1. No. of radio talks conducted (target: 180) | 180000 | 36000 | 36000 | 36000 | 36000 | 36000 |
| challenge harmful gender stereotypes and promote positive attitudes. | challenge harmful gender stereotypes
and promote positive attitudes |
(target: 60%)
listeners indicating improved understanding and rejection of harmful gender stereotypes (target: 85% positive feedback) |
|
||||||
| SUB-TOTAL | 1053000 | 210600 | 210600 | 210600 | 210600 | 210600 | |||
| THEMATIC AREA 6: SOCIO-ECONOMIC EMPOWERMENT | |||||||||
| SO 5.11 To contribute to poverty reduction by Fostering socio-economic resilience and sustainable livelihoods among vulnerable populations
|
|||||||||
| 5.11 .1 Vocational
skills training (Carpentry, Tailoring, Hair dressing, Soap making and metal fabrication) to 250 |
1. Provided vocational skills training to 250 AGYW, youth, OVC, and their households |
|
170000 | 34000 | 34000 | 34000 | 34000 | 34000 |
|
| AGYW, youth, OVC and their households. | 2. Equipped beneficiaries with skills in:
|
150)
of beneficiaries reporting improved economic stability (target: 70%) 5. Feedback from beneficiaries indicating improved confidence and self-esteem (target: 85% positive feedback) |
beneficiaries with marketable skills 3. Beneficiaries will have access to resources and support to start their own businesses or find employment
4. Training will lead to improved economic stability and reduced poverty 5. Beneficiaries will be able to apply skills learned to improve their livelihoods |
||||||
| 5.11.2
Entrepreneurship and business skills training to 500 AGYW, Youths and OVCs |
AGYW, Youths, and OVCs
– Entrepreneurship |
of beneficiaries reporting improved entrepreneurship and business skills (target: 85%)
300)
|
and reduced poverty
|
||||||
| 5.11.3 Establish the trained individuals | 1. No. of groups established (target: 5) | 105000 | 21000 | 21000 | 21000 | 21000 | 21000 | 1. Trained individuals will be willing to |
| into 5 groups basing on their respective training and then provide these groups with respective start-up kits. |
carpentry, tailoring, hair dressing, soap making, metal fabrication)
trade |
2. No. of individuals in each group (target: 100) 3. Quality and relevance of start-up kits provided (target: 90% satisfaction rate)
4. Increase in percentage of individuals reporting improved ability to start or expand their businesses (target: 85%) 5. Feedback from individuals indicating improved confidence and self-esteem (target: 90% positive feedback) |
form groups and work together
2. Start-up kits will be relevant and effective in supporting individuals to start or expand their businesses 3. Individuals will have access to markets and customers for their products
|
||||||
| 5.11.4 Life skills training for 500
AGYW, youths and OVCs |
AGYW, youths, and OVCs
|
(target: 80%)
400)
(target: 75%) |
70000 | 14000 | 14000 | 14000 | 14000 | 14000 |
|
| – Goal setting and planning – Healthy relationships and boundaries | 5. Feedback from beneficiaries indicating improved ability to make informed decisions and set goals (target: 85% positive feedback) | 5. Beneficiaries will be able to maintain
and build on life skills learned over time |
|||||||
| 5.11.5 Computer
literacy and digital skills training to 250 AGYW, and Youths |
AGYW and Youths
(Word, Excel, PowerPoint, etc.) – Internet and email usage – Online safety and digital citizenship – Basic coding and programming concepts |
of beneficiaries reporting improved computer literacy and digital skills (target: 85%)
80%)
|
5. Beneficiaries will be able to maintain and build on skills learned over time |
||||||
| SUB-TOTAL |
345000 |
69000 | 69000 | 69000 | 69000 | 69000 | |||
| THEMATIC AREA 7: ENVIRONMENT AND CLIMATE CHANGE | |||||||||
| SO 5.12 Strengthen Environmental protection and uptake of Climate
resilience/protection Technologies in 50 Schools and 50 health facilities in response to Climate Change |
|||||||||
| 5.12.1 Planting
Trees and Grass on 50 school and 50 health facility compounds |
grass on 50 school compounds
|
(target: 50)
(target: 50)
conditions (target: 90%) 4. No. of trees and grasses planted (target: 5,000) 5. Feedback from school and health facility administrators indicating improved environmental conditions (target: 95% positive feedback) |
10000 | 2000 | 2000 | 2000 | 2000 | 2000 |
and health facility compounds
maintenance activities |
| 5.12.2 Installation of Clean Energy
Cooking technology (Solar, biogas) in 20 high volume boarding primary and secondary schools |
1. Installed clean energy cooking technology (Solar, biogas) in 20 highvolume boarding primary and secondary schools 2. Reduced reliance on firewood and charcoal for cooking in schools |
(target: 20)
consumption in schools (target: 75%)
|
260000 | 52000 | 52000 | 52000 | 52000 | 52000 |
|
| 3. Improved air quality and reduced indoor air pollution in schools 4. Decreased greenhouse gas emissions from cooking activities in schools | indoor air pollution in schools (target: 80%) 4. Decrease in greenhouse gas emissions from cooking activities in schools
(target: 70%) 5. Feedback from school administrators and students indicating improved cooking experience and reduced environmental impact (target: 90% positive feedback)
|
firewood and charcoal
|
|||||||
| 5.12.3 Training of
250 teachers, SMC, PTA, HUMC, health workers, Environmental officers on Climate change resilience |
1. Trained 250 teachers, SMC, PTA, HUMC, health workers, and Environmental officers on Climate Change Resilience 2. Equipped trainees with knowledge and skills on:
|
(target: 250)
85%)
80%) 5. Feedback from trainees indicating improved confidence |
50000 | 10000 | 10000 | 10000 | 10000 | 10000 |
1. Trainees will be willing and able to participate in training 2. Training will be effective in equipping trainees with knowledge and skills on climate change resilience
and health facilities
|
| – | |||||||||
| 5.12.3 Installation of Lighting
rods/conductors on 50 Health facilities and 50 Schools |
1. Installed lightning rods/conductors on
50 health facilities 2. Installed lightning rods/conductors on 50 schools
patients, and health workers |
1. No. of health facilities with lightning
rods/conductors installed (target: 50) 2. No. of schools with lightning rods/conductors installed (target: 50) 3. Reduction in No. of lightning-related incidents in health facilities and schools (target: 90%) 4. Improvement in safety and protection of students, teachers, patients, and health workers (target: 95%) 5. Feedback from health facility and school administrators indicating improved safety and reduced risk (target: 98% positive feedback) |
45000 | 9000 | 9000 | 9000 | 9000 | 9000 | 1. Health facilities and schools will allow and support installation of lightning
rods/conductors 2. Lightning rods/conductors will be effective in reducing risk of lightning strikes and electrical shocks
experienced technicians
lightning rods/conductors regularly 5. Lightning rods/conductors will be durable and longlasting |
| 5.12.4 Annual Climate change education and awareness campaigns | 1. Conducted annual climate change education and awareness campaigns 2. Reached a minimum of 10,000 people (students, teachers, community members) per campaign |
of participants with knowledge and understanding of climate change (target: 80%) |
80000 | 16000 | 16000 | 16000 | 16000 | 16000 |
|
|
4. No. of participants reporting behavioral change or community action on climate change
(target: 60%) 5. Feedback from participants indicating improved awareness and understanding of climate change (target: 90% positive feedback) |
5. Behavioral change
and community action will be measurable and observable |
|||||||
| SUB-TOTAL | 445000 | 89000 | 89000 | 89000 | 89000 | 89000 | |||
| THEMATIC AREA 8: EDUCATION FOR WOMEN, YOUTHS&CHILDREN | |||||||||
| SO:5.14: Improve the quality, accessibility, and inclusivity of education for 2500 disadvantaged groups by 2028 through capacity-building for educators, fostering youth leadership in extracurricular activities, and promoting gender equality in the learning environment | |||||||||
| 5.14.1 Construct or rehabilitate a school in targeted area. |
|
1. No. of schools constructed or
rehabilitated (target: 1) 2. No. of students benefiting from improved educational infrastructure (target: 500)
(target: 20%)
|
1100000 | 220000 | 220000 | 220000 | 220000 | 220000 |
4. Improved infrastructure will lead to enhanced learning outcomes 5. Sustainability and maintenance of the school infrastructure |
| 5.14.2 Mobilize scholastic materials, uniforms, sanitary pads and School fees for 5000 disadvantaged students. | 1. Mobilized scholastic materials (books, pens,
pencils, etc.) for 5000 disadvantaged students 2. Provided uniforms for 5000 disadvantaged students
for 5000 disadvantaged students |
1. No. of students receiving scholastic materials (target: 5000) 2. No. of students receiving uniforms (target: 5000) 3. No. of female students receiving sanitary pads (target:
2500)
5000)
|
500000 | 100000 | 100000 | 100000 | 100000 | 100000 | 1. Availability of resources (funding, materials, etc.) for mobilization 2. Effective distribution channels for materials and fees 3. Identification and targeting of disadvantaged students
|
| 5.14.3 Conduct biannual training workshops for 100 teachers on modern pedagogy and childcentered learning | 1. Conducted
biannual training workshops for 100 teachers on modern pedagogy and childcentered learning 2. Equipped teachers with knowledge and skills on:
evaluation strategies
|
90% positive feedback) 5. Observation of teaching practices indicating increased use of modern pedagogy and child-centered learning (target: 85%) |
46000 | 9200 | 9200 | 9200 | 9200 | 9200 |
1. Teachers will be willing and able to participate in training 2. Training will be effective in improving teaching practices 3. Teachers will have opportunities to apply new skills and knowledge
better learning outcomes
|
| 5.14.4 Conduct 20 quarterly awareness campaigns and events to raise awareness about the importance of
girls’ education and women’s empowerment. among community members. |
10,000)
|
(target: 20)
(target: 10,000)
women’s empowerment (target: 75%) 4. Feedback from community members indicating increased support and engagement (target: 80% positive feedback) 5. No. of community-led initiatives or activities promoting girls’ education and women’s empowerment (target: 10) |
24000 | 4800 | 4800 | 4800 | 4800 | 4800 |
empowerment
executed
|
| 5.14.5 Distribute 10,000 IEC materials to raise awareness about the importance of
girls’ education and women’s empowerment among community members. |
|
10,000)
(target: 20,000)
women’s empowerment (target: 70%) 4. Feedback from community members indicating increased knowledge and |
41000 | 8200 | 8200 | 8200 | 8200 | 8200 | 1. IEC materials will
be effective in raising awareness 2. Community members will be receptive and engaged
|
| women’s empowerment | understanding (target: 85% positive feedback) 5. No. of community-led
initiatives or activities promoting girls’ education and women’s empowerment (target: 5) |
community engagements | |||||||
| 5.14.6 Provide Accessible infrastructure like wheelchair, wide doors, handrails etc.
in 50 schools for students with disabilities |
1. Installed accessible infrastructure in 50 schools, including: – Wheelchair ramps
2. Improved physical accessibility for students with disabilities 3. Enhanced inclusivity and learning environment |
(target: 50)
500)
25%)
|
250000 | 50000 | 50000 | 50000 | 50000 | 50000 |
4. Infrastructure will be well-maintained and sustainable 5. Improved accessibility will lead to increased attendance and inclusivity |
| 5.14.7 Establish and support 50 school clubs and youth-led initiatives. |
clubs and youth-led initiatives
|
1. No. of school clubs and youth-led initiatives established and supported (target: 50) 2. No. of student participants (target:
1,000) 3. Increase in percentage of students taking |
250000 | 50000 | 50000 | 50000 | 50000 | 50000 |
|
| 3. Fostered a sense of community and
social responsibility among students 4. Provided a platform for students to express themselves and showcase their talents |
leadership roles (target:
30%)
|
establishment of school clubs and youth-led initiatives 3. Adequate resources and funding will be available
students’ life skills and sense of community |
|||||||
| 5.14.8 Organize sports and cultural activities to
promote teamwork, discipline, and a sense of community in 50 schools. |
and cultural activities in 50 schools
discipline, and a sense of community among students 3. Encouraged student participation and engagement 4. Fostered a positive school culture and environment |
50)
2,000)
teamwork and discipline (target: 25%) 4. Feedback from students, teachers, and parents indicating improved sense of community (target: 85% positive feedback) 5. Sustainability of sports and cultural activities beyond project duration (target: 80%) |
150000 | 30000 | 30000 | 30000 | 30000 | 30000 |
discipline, and sense of community |
| SUB-TOTAL | 2361000 | 472200 | 472200 | 472200 | 472200 | 472200 | |||
| THEMATIC AREA 9: ORPHANS AND VULNERABLE CHILDREN IN GREATER JINJA | |||||||||
| SO 5.15: Contribute to the reduction in child poverty and deprivation through comprehensive prevention and response programs. | |||||||||
| 5.15.1: Identify and register 1000 OVCs. |
registered 1000 OVCs
services and program |
1. No. of OVCs
identified and registered (target: 1000) 2. Accuracy and completeness of data collected (target: 95%) 3. No. of OVCs linked to support services and programs (target: 900) 4. Feedback from OVCs and caregivers indicating improved access to support services (target: 85% positive feedback) 5. Data quality and management (target: 90%) |
65000 | 13000 | 13000 | 13000 | 13000 | 13000 |
1. OVCs will be willing and available for registration 2. Caregivers and community members will provide accurate information 3. Adequate resources and funding for registration and data management
|
| 5.15.2: Support access to business
financial services for 250 OVC households through microfinance agencies. |
1. Supported access to business financial services for 250 OVC households 2. Linked OVC households to microfinance agencies
3. Provided training on financial literacy and entrepreneurship |
1. No. of OVC households accessing business financial services (target: 250) 2. No. of OVC households receiving training on financial literacy and entrepreneurship
(target: 250) |
105000 | 21000 | 21000 | 21000 | 21000 | 21000 | 1. OVC households will be interested and eligible for
microfinance services 2. Microfinance agencies will provide accessible and affordable services 3. Training on financial literacy and entrepreneurship will be effective |
| 4. Increased income and economic stability for OVC households | 3. Increase in average income of OVC households (target: 20%) 4. Feedback from OVC households indicating improved economic
stability (target: 85% positive feedback) 5. Repayment rate of microfinance loans (target: 90%) |
income-generating activities
|
|||||||
| 5.15.3: Facilitate access to market information for 500 OVC households to help them sell their products. |
4. Increased sales and income for OVC households |
(target: 500)
5. No. of OVC households linked to market opportunities and buyers (target: 400) |
130000 | 26000 | 26000 | 26000 | 26000 | 26000 |
will have products to sell
pricing will be effective
|
| 5.15.4: Provide
social assistance to 500 OVC households to address hunger and malnutrition. Develop and implement early |
Social Assistance: 1. Provided social assistance to 500
OVC households 2. Addressed hunger and malnutrition |
Social Assistance: 1. No. of OVC households receiving social assistance (target:
500) 2. Reduction in hunger and malnutrition among |
900000 | 180000 | 180000 | 180000 | 180000 | 180000 |
be effective in improving |
| childhood development
programs to 500 OVCs |
through food assistance
3. Improved food security and wellbeing for OVC households. ECD Programs:
programs for 500 OVCs
OVCs
|
OVC households
(target: 25%) 3. Feedback from OVC households indicating improved food security (target: 85% positive feedback) ECD Programs
1. No. of OVCs participating in ECD programs (target: 500) 2. Improvement in cognitive, social, and emotional development among OVCs (target: 30%) 3. Feedback from caregivers and teachers indicating improved school readiness (target: 85% positive feedback) |
development outcomes
and participate in ECD programs
and ECD programs will be wellcoordinated and implemented
|
||||||
| 5.15.5: Provide high quality agricultural inputs/tools, seeds/plantings and
stocking materials to 500 OVC households. Provide economic empowerment opportunities for caregivers |
1. Provided highquality agricultural inputs/tools, seeds/plantings, and
stocking materials to 500 OVC households 2. Enhanced agricultural productivity and food security for OVC households 3. Provided economic empowerment opportunities for caregivers through |
1. No. of OVC households receiving agricultural inputs and support (target: 500) 2. Increase in agricultural productivity and food security among OVC households (target: 35%) 3. No. of caregivers participating in economic empowerment opportunities (target:
500) 4. Feedback from caregivers indicating improved economic stability (target: 85% positive feedback) |
500000 | 100000 | 100000 | 100000 | 100000 | 100000 |
willingness to participate in agricultural activities 3. Agricultural inputs and support will be of high quality and relevant to local context 4. Economic empowerment opportunities will be |
| agricultural training and support | 5. Increase in household income among OVC
households (target: 25%) |
effective in improving household income
5. Positive impact on food security, economic stability, and well-being for OVCs |
|||||||
| 5.15.6: Establish and train 100 VHT and encourage them to make OVC a key
priority and target group. |
1. Established and trained 100 VHTs 2. VHTs equipped to provide health
and social support to OVCs 3. OVCs prioritized as a key target group by VHTs |
(target: 100)
indicating confidence in supporting OVCs (target: 85% positive feedback) 5. No. of OVCs receiving regular home visits and support from VHTs (target: 500) |
150000 | 30000 | 30000 | 30000 | 30000 | 30000 |
1. VHTs will be willing and able to prioritize OVCs 2. Training will be effective in equipping VHTs to support OVCs
and social support for OVCs |
| 5.15.8 Provide
Psychosocial, Child Protection and Legal Support to 1000 OVC. |
1. Provided PSS to
1000 OVC
services to 1000 OVC
Support (LS) to 1000 OVC |
1. No. of OVC receiving
PSS (target: 1000) 2. No. of OVC receiving CP services (target: 1000) 3. No. of OVC receiving LS (target: 1000) 4. Increase in OVC’s emotional well-being and resilience (target: 30%)
|
440000 | 88000 | 88000 | 88000 | 88000 | 88000 |
LS services
provide services
|
| SUB-TOTAL | 2290000 | 458000 | 458000 | 458000 | 458000 | 458000 |
|
THEMATIC AREA 10: ROMIC MEDICAL CENTRE |
|||||||||
| SO 16. To provide accessible and affordable medical care services to vulnerable communities, improving their overall health and well-being.
|
|||||||||
| 5.16.1. General Medical Services: – Provide outpatient consultations and treatment 50 vulnerable people per day for common illnesses and chronic conditions
– Offer maternal and child health services, including antenatal and postnatal care to 10 people per day. |
|
(target: 50)
6 months)
|
900000 | 180000 | 180000 | 180000 | 180000 | 180000 | 1. Vulnerable populations will be aware of and access the medical services 2. Trained medical staff will be available to provide quality care
will be in place for complex cases 5. Community engagement and outreach activities will support service uptake 6. Data collection and reporting systems will be functional to track progress |
| 5.16.2. Medicolegal Services:
– Provide medical examination and documentation to 20 survivors per day for legal purposes |
|
(target: 20)
|
600000 | 120000 | 120000 | 120000 | 120000 | 120000 |
|
| (e.g., court cases, insurance claims) – Offer counseling and support services for 20 survivors per day of gender-based violence and other forms of abuse | support services for gender-based violence and other forms of abuse | support services per day
(target: 20)
|
will be available to provide quality care 3. Confidentiality and privacy will be ensured for survivors 4. Collaboration with legal and law
enforcement agencies will facilitate use of medical documentation 5. Community engagement and outreach activities will support service uptake 6. Data collection and reporting systems will be functional to track progress |
||||||
| 5.16.3. Laboratory Services: – Conduct diagnostic tests and examinations (e.g., blood tests, urinalysis, stool tests) for 50 vulnerable people per day.
– Provide results interpretation and recommendations to 50 individuals per day for further treatment |
recommendations for further treatment |
(target: 50)
recommendations per day (target: 50)
|
600000 | 120000 | 120000 | 120000 | 120000 | 120000 |
accuracy and reliability
|
| 5.16.4. Community Outreach and Engagement: – Organize quarterly health fairs and outreach programs to raise awareness about available services – Engage with 50 local leaders and 50 community groups to promote the medical Centre and
its services |
its services |
(target: 4)
(target: 50)
(target: 30% increase in 6 months)
|
65000 | 13000 | 13000 | 13000 | 13000 | 13000 |
will be receptive to engagement and promotion
support outreach activities 5. Collaboration with local leaders and community groups will facilitate promotion and utilization of services
|
|||||||||||
| 5.16.5. Capacity Building and Quality Improvement:
– Provide training and capacity-buildin programs for 15 and medical staff – Conduct monthly quality assurance and |
g |
capacity-building programs
activities conducted |
1. No. of medical staff receiving training and capacity-building programs (target: 15) 2. Frequency of quality assurance and
improvement activities (target: monthly) 3. Improvement in medical staff knowledge
|
50000 | 10000 | 10000 | 10000 | 10000 | 10000 |
capacity-building programs
improving knowledge and skills
|
||||||||||
| SUB-TOTAL | 2215000 | 443000 | 443000 | 443000 | 443000 | 443000 | ||||||||||||||
| GRAND-TOTAL | 14592700 | 2918540 | 2918540 | 2918540 | 2918540 | 2918540 | ||||||||||||||
7.0 MONITORING AND EVALUATION FRAMEWORK
| Result | Indica tor | Definition
How Is It Calculated? |
Data
Source |
Basel ine
What Is the Curre nt Value? |
Target | 2025 | 2026 | 2027 | 2028 | 2029 | Freque ncy | Who
Will Measure |
Reportin g |
| THEMATIC AREA 1: HIV/AIDs | |||||||||||||
| SO5.1: To mitigate the spread of HIV/AIDS and offer comprehensive care and support to individuals impacted by the virus in greater
Jinja, with a focus on AGYWs, men, and youths |
|||||||||||||
| 5.1.1:
Conduct 80 AGYW and youthfriendly HCT outreaches to 10000 in and out of school youths and AGYWs |
No. of outreaches conducted | No. of community-based outreaches conducted to reach key and priority populations with HCT services. | Outreach reports, program records | 0 | 80 | 12 | 16 | 20 | 24 | 8 | Quarterly |
Program reports, quarterly reviews, annual reports
|
|
| No. of youths and
AGYWs reached with HCT services |
No. of in and out of school youths
and AGYWs who received HCT services. |
Outreach reports, program records, HCT service register | 0 | 1,500 | 2,000 | 2,500 | 3,000 | 1,000 | Quarterly | Program reports, quarterly reviews, annual reports | |||
| (target: 10,000) | |||||||||||||
| Percentage of youths
and AGYWs tested for HIV |
Percentage of in and out of school
youths and AGYWs who received HCT out of the total No. reached with HCT services. |
Outreach reports, program records, HCT service registers | 0 | 1,200 youths and AGYWs
tested (80% of 1,500 reached)
|
1,600 youths and AGYWs
tested (80% of 2,000 reached) |
2,000 youths and AGYWs
tested (80% of 2,500 reached) |
2,400 youths and
AGYWs tested (80% of 3,000 reached) |
800 youths
and AGYWs 80% of 1,000 reached) |
Quarterly | Program reports, quarterly reviews, annual reports | |||
| No. of youths and
AGYWs counseled on HIV prevention and risk reduction |
No. of in and out of school youths
and AGYWs who received counseling services on HIV prevention and risk reduction. |
Outreach reports, program records, counseling service registers | 1,200 youths and AGYWs counseled (80% of 1,500 reached) | 1,600 youths and AGYWs counseled
(80% of 2,000 reached) |
2,000 youths and AGYWs counseled (80% of 2,500 reached) | 2,400 youths and
AGYWs counseled (80% of 3,000 reached) |
800 youths
and AGYWs counsele d (80% of 1,000 reached) |
Quarterly | Program reports, quarterly reviews, annual reports | ||||
| No. of youths and
AGYWs referred to care and treatment services |
No. of in and out of school youths
and AGYWs who tested positive for HIV and were referred to care and treatment services. |
Outreach reports, program records,
referral forms |
500 | 75 youths and
AGYWs referred (5% of 1,500 reached) |
100 youths and AGYWs referred (5% of 2000 reached) | 125 youths and AGYWs referred (5% of 2,500 reached) | 150 youths and
AGYWs referred (5% of 3,000 reached) |
50 youths
and AGYWs referred (5% of 1,000 reached) |
Quarterly | Program reports, quarterly reviews, annual reports | |||
| Satisfaction rate among
youths and AGYWs with HCT services |
Percentage of in and out of school
youths and AGYWs who reported being satisfied with the HCT services received. |
Client satisfaction surveys, feedback forms |
|
90%
satisfaction rate |
90%
satisfaction rate (1,350 out of 1,500 reached) |
90%
satisfaction rate (1,800 out of 2,000 reached) |
90%
satisfaction rate (2,250 out of 2,500 reached) |
90%
satisfaction rate (2,700 out of 3,000 reached) |
90%
satisfacti on rate (900 out of 1,000 reached) |
Quarterly | Program reports, quarterly reviews, annual reports | ||
| No. of new HIV cases identified | No. of in and out of school youths
and AGYWs who tested positive for HIV through the program’s testing services. |
Outreach reports, program records, testing registers |
|
500 | 75 new HIV cases identified (5% of 1,500 reached) | 100 new HIV cases identified (5% of 2,000 reached) | 125 new HIV cases identified (5% of 2,500 reached) | 150 new HIV cases identified (5% of 3,000 reached) | 50 new HIV cases identifie d (5% of 1,000 reached) | Quarterly | Program reports, quarterly reviews, annual reports |
| Percentage of youths
and AGYWs who know their HIV status. |
Percentage of in and out of school
youths and AGYWs who have received their HIV test results and know their HIV status. |
Outreach reports, program records, testing registers | 80% | 80% of 1,500 reached = 1,200 youths and AGYWs
knowing their HIV status |
80% of 2,000 reached = 1,600 youths and AGYWs knowing their HIV status | 80% of 2,500 reached = 2,000 youths and AGYWs
knowing their HIV status |
80% of 3,000 reached = 2,400 youths and
AGYWs knowing their HIV status |
80% of 1,000 reached = 800 youths
and AGYWs knowing their HIV status |
Quarterly | Program reports, quarterly reviews, annual reports | |||
| 5.1.2Condu ct 50 HCT Outreaches targeting 5000 individuals HIV Hot spots and socializing places. | No. of individuals reached with HCT
services |
No. of individuals who received HCT services during the 50 outreaches conducted in HIV hotspots and socializing places. | Outreach reports, program records, HCT service registers | 5000 | 1,000
individuals reached (20% of target)
|
1,200 individuals reached (24% of target)
|
1,500
individuals reached (30% of target)
|
800 individuals reached (16% of target)
|
500 individua
ls reached (10% of target) |
Quarterly | Program staff, outreach teams |
|
|
| No. of individuals counseled on HIV prevention and risk reduction. | No. of individuals who received counseling services on HIV prevention and risk reduction during the outreaches. | Outreach reports, program records, counseling service registers | 4,500 | 900 | 1,080 | 1,350 | 720 | 450 | Quarterly | Program staff, outreach teams |
|
||
| No. of individuals referred to care and treatment services | No. of individuals who tested positive for HIV and were referred to care and treatment services during the outreaches. | Outreach reports, program records, referral forms | 250 | 50 | 60 | 75 | 40 | 25 | Quarterly |
|
| Satisfaction rate among individuals with HCT
services |
Percentage of individuals who reported being
satisfied with the HCT services received during the outreaches. |
Client satisfaction surveys, feedback forms | 90% | 88% | 89% | 90% | 91% | 92% |
|
||||
| No. of new HIV cases
identified . |
No. of individuals who tested positive for HIV for the first time during the outreaches | Outreach reports, program records, testing registers. | 150 | 30 | 36 | 45 | 24 | 15 |
|
||||
| Percentage of individuals
who know their HIV status: |
Percentage of individuals who have received their HIV test results and know their HIV status. | Outreach reports, program records, testing registers | 60% | 12% | 14.4% | 18% | 21.6% | 60% | Quarterly | Program staff, outreach teams |
|
||
| 5.1.3: Index HIV client testing to
250 |
No. of individuals indexed for HIV testing | No. of individuals who are
identified as highrisk or vulnerable to HIV and are indexed for HIV testing during the outreaches. |
Outreach reports, program records, testing registers | 250 | 50 | 60 | 75 | 40 | 25 | Quarterly | Program staff, outreach teams |
|
|
| Percentage of individuals who tested | Percentage of individuals who received HCT services and | Outreach reports, program records, | 10% | 5% | 6% | 8% | 9% | 10% |
| positive for HIV. | tested positive for HIV. | testing registers | |||||||||||
| . NO. of individuals linked to care and treatment services. | NO. of individuals who tested positive for HIV and were linked to care and treatment services during the outreaches. | Outreach reports, program records,
referral forms |
25 | 5 | 6 | 8 | 4 | 2 | Quarterly |
reports (if applicable) |
|||
| Satisfaction rate among
individuals with HCT services. |
Percentage of individuals who reported being satisfied with the HCT services received during the outreaches. | Client satisfaction surveys, feedback forms | 95% | 92 | 93 | 94 | 95 | 96 | Quarterly |
|
|||
| 5.1.4:
Assisted Partner Notificatio n (APN) |
Percentage of index clients who
receive APN services |
Percentage of individuals who tested positive for HIV or STIs
(index clients) who receive APN services to notify their sexual partners about their exposure. |
APN
records, program reports |
80% | 60% | 68% | 75% | 78% | 80% | Quarterly |
|
||
| No. of partners notified per index client | Average no. of sexual partners notified about their exposure to HIV or STIs through APN services per index client. | APN
records, program reports |
2 partners notified per index client | ||||||||||
| .
Percentage |
Percentage of sexual partners | APN
records, |
90% | 80% | 85% | 88% | 90% | 92% | Quarterly | Program staff, outreach | – Program reports |
| of partners tested for HIV. | notified through APN services who are tested for HIV | program reports, testing data | teams, testing services |
|
|||||||||
| Percentage of partners linked to care and treatment services. | Percentage of sexual partners notified through APN services who test positive for HIV and are linked to care and treatment services. | APN
records, program reports, care and treatment data |
85% of partners linked to care and treatment | 75% | 80% | 82% | 85% | 88% | Quarterly | Program staff, outreach teams, care and treatment services |
|
||
| Time from
index client testing to partner notification . |
Average time in days from when the index client tests positive for HIV to when their sexual partners are notified about their exposure through APN services. | APN
records, program reports, testing data |
Less than 30 days | 25 | 22 | 20 | 18 | 15 | Quarterly | Program staff, outreach teams, testing services |
|
||
| 5.1.5:
Install 500 condom dispensers in 500 socializing places/HIV Hot spots |
No. of condom
dispensers installed |
No. of condom dispensers installed. | Program records, installation reports, monitoring data | 500 | 200 | 300 | 375 | 425 | 500 | Quarterly | Program staff, outreach
teams, community mobilizers
|
|
|
| No.of
socializing places /HIV hotspots covered |
No. of socializing places and HIV hot spots that are covered by HIV prevention and testing | Program records, outreach reports, mapping data | 500 | 300 | 375 | 425 | 475 | 500 | Quarterly | Program staff, outreach teams, community mobilizers |
|
| services, including condom distribution and Assisted Partner Notification
(APN) activities. |
|
||||||||||||
| User
satisfaction with condom dispenser locations and accessibility satisfaction rate |
Percentage of users who report being satisfied with the locations and
accessibility of condom dispensers installed in socializing places and HIV hotspots. |
User feedback surveys, program records, and monitoring data | 90% | 80% | 85% | 88% | 90% | 92% | Program
Manager, Outreach Coordinator |
|
|||
| 5.1.6
Collaborat e with Public facilities to distribute and Refill Dispensers in socializing places with Condoms |
No. of public
facilities partnered with for condom distribution and dispenser refilling |
No. of public facilities (such as
health clinics, community centers, and public restrooms) that have partnered with the program to distribute condoms and refill condom dispensers. |
Partnership agreements, program records, and monitoring data | 50 | 20 | 30 | 40 | 45 | 50 | Program
Manager, Outreach Coordinator |
|
||
| No.of
socializing places receiving condoms through public facilities |
No. of socializing places that receive condoms through partnerships with public facilities. | Program records, partnership agreements, and monitoring data | 200 | 80 | 120 | 160 | 180 | 200 | Program
Manager, Outreach Coordinator |
|
|||
| ReOrientatio n of VHTs and | No. of VHTs reoriented | No. of VHT members who
have received reorientation |
Training records, program reports, and | 500 | 100 | 200 | 100 | 50 | 50 | Program
Manager, |
– Program reports |
| Communit
y structures (including) CSW, peers of KPs on Basics in HIV (Literacy Education)
|
on HIV basics | training on HIV basics, including prevention, testing, and treatment. | monitoring data | Training
Coordinator |
|
||||||||
| No.of community structures (CSWs,
peers of KPs) reoriented on HIV basics |
No. of community structures, including CSWs and peers of KPs, who have received reorientation training on HIV basics, including prevention, testing, and treatment. | Training records, program reports, and monitoring data | 200 | 20 | 40 | 40 | 50 | 50 | Quarterly | Program
Manager, Training Coordinator |
|
||
| Pre- and posttraining assessment s showing increased knowledge and understand ing of HIV basics ( | Percentage increase in knowledge and understanding of HIV basics among community structures. | Training records, assessment data, and program reports | 80% | 10% | 20% | 20% | 20% | 10% | Program
Manager, Training Coordinator |
|
|||
| . VHTs and community structures
demonstrat e ability to educate others on HIV basics |
Percentage of VHTs and community structures who demonstrate the ability to educate others on HIV basics, including prevention, testing, and treatment. | Observation records, program reports, and monitoring data | 90% | 10% | 20% | 20% | 20% | 20% | Quarterly | Program
Manager, Training Coordinator |
|
||
| 5.1.8:
Engage |
No. of
Parish Task |
No. of Parish
Task Forces and |
Task Force records, | 50 | 5 | 15 | 10 | 10 | 10 | Program
Manager, |
– Program reports |
| Parish Task
Forces and Sub- County Task forces on HIV/Aids |
Forces and
SubCounty Task Forces engaged |
Sub-County Task Forces that are actively engaged in HIV prevention and response activities. | program reports, and monitoring data | Community
Engagement Coordinator |
|
||||||||
| Frequency of meetings and
activities conducted by Parish Task Forces and SubCounty Task Forces |
No. of meetings and activities conducted by Parish Task
Forces and SubCounty Task Forces per quarter, to ensure regular engagement and progress in HIV prevention and response activities. |
Task Force records, meeting minutes, and program reports | 15 | 3 | 3 | 3 | 3 | 3 | Quarterly | Program
Manager, Community Engagement Coordinator |
|
||
| Level of participatio n and
engagemen t from stakeholde rs |
Percentage of stakeholders
(including community members, leaders, and partners) who participate in and engage with Parish Task Forces and Sub- County Task Forces, measured by attendance rates at meetings and activities. |
Attendance records, meeting minutes, and program reports | 80% | 10% | 20% | 20% | 20% | 10% | Program
Manager, Community Engagement Coordinator |
|
|||
| No. of joint
activities and initiatives implement ed by Parish Task Forces and Sub- |
No. of joint activities and
initiatives implemented by Parish Task Forces and SubCounty Task Forces to promote |
Task Force records, program reports, and monitoring data | 20 | 3 | 5 | 5 | 5 | 2 | Program
Manager, Community Engagement Coordinator |
|
| County
Task Forces |
collaboration and coordination in HIV prevention and response efforts. | – Donor reports | |||||||||||
| 5.1.9:
ReOrientatio n/Training of Testers in Sub- County private and public health facilities on HIV Testing – Testers in Sub- County private and public health facilities reoriented/tr ained on HIV testing |
No. of testers reoriented/tr ained | No. of testers (health workers, community health workers, etc.) who have received reorientation or training on HIV testing protocols, procedures, and guidelines. | Training records, program reports, and monitoring data | 200 | 50 | 50 | 40 | 40 | 20 | Program
Manager, Training Coordinator |
|||
| Pre- and posttraining assessment s showing increased knowledge
and skills (target: 80% increase) |
Percentage increase in knowledge and skills among testers (health workers, community health workers, etc.) on HIV testing protocols, procedures, and guidelines, as measured by pre- and post-training assessments. | Training records, assessment
data, and program reports |
80% | 10% | 20% | 20% | 20% | 10% | Program
Manager, Training Coordinator |
||||
| Observed
practice of testers demonstrat ing correct HIV testing procedures . |
Percentage of testers who demonstrate correct HIV
testing procedures during observed practice.
|
Observation records, program reports, and monitoring data | 90% | 20% | 20% | 20% | 20% | 10% | Quarterly | Program
Manager, Training Coordinator |
|
| Feedback from testers and
facilities on improved quality of HIV testing services |
Percentage of positive feedback from testers and facilities on the quality of HIV testing services. | Feedback forms,
surveys, and program reports |
85% | 15% | 20% | 20% | 20% | 20% | Quarterly | Program
Manager, Quality Assurance Coordinator |
|
||
| 5.1.10:
Conduct home visits and provide ART adherence psychosoci al support to 500 PLHIV. |
No. of PLHIV
receiving home visits and ART adherence psychosoci al support |
No. of PLHIV who receive home visits and ART adherence psychosocial support to improve treatment adherence and overall wellbeing. | Home visit records, program reports, and monitoring data | 500 | 100 | 100 | 100 | 100 | 100 | Quarterly | Program
Manager, Psychosocial Support Coordinator |
|
|
| Percentage of PLHIV with improved ART
adherence. |
Percentage of
PLHIV who show improved adherence to ART after receiving home visits and psychosocial support |
Home visit records, program reports, and monitoring data | 80% | 20% | 20% | 20% | 20% | 10% | Program
Manager, Psychosocial Support Coordinator |
|
|||
| Percentage of PLHIV reporting improved psychosoci al wellbeing | Percentage of PLHIV who report improved psychosocial well-being, including reduced stress, anxiety, and depression, and improved overall mental health and quality of life. | Surveys, interviews, and program reports | 85% | 15% | 20% | 20% | 20% | 20% | Program
Manager, Psychosocial Support Coordinator |
|
| No. of PLHIV
retained in care and treatment |
No. of PLHIV who are retained in HIV care and treatment services, including ART, over a 12-month period. | Clinic records, program reports, and monitoring data | 90% | 20% | 20% | 20% | 20% | 10% | Program
Manager, Clinical Coordinator |
|
|||
| Satisfaction rate among PLHIV with home visits and psychosoci al support | Percentage of PLHIV who report being satisfied with the home visits and psychosocial support services they received. | Client satisfaction surveys, feedback forms, and program reports | 90% | 20% | 20% | 20% | 20% | 10% | Program
Manager, Psychosocial Support Coordinator |
|
|||
| 5.1.11
Strengthen PLHIV Nets works in villages & peer to peer PSS Offer economic empowerm ent programs to 200 PLHIV and their families |
No. of PLHIV networks strengthen ed in villages | No. of villagelevel networks of PLHIV that have been strengthened through training, capacity building, and support. | Network
registration records, program reports, and monitoring data |
20% | 5% | 5% | 5% | 3% | 2% | Program
Manager, Community Engagement Coordinator |
|
||
| No. of PLHIV
receiving peer-topeer PSS. |
The total No. of PLHIV who receive peer-topeer PSS services from trained peer mentors or support group members. | Program records and reports
Support group attendance records Peer mentor session logs Surveys or feedback forms from |
Quarterly | Program
Manager, Peer Support Coordinator |
| PLHIV receiving PSS | |||||||||||||
| No. of PLHIV and their families
receiving economic empowerm ent programs |
The total no. of PLHIV and their family members who receive economic empowerment programs. | Program records and reports
Training attendance records IGA and microfinance initiative records Surveys or feedback forms from PLHIV and their families |
200 | 40 | 40 | 40 | 40 | 40 | Quarterly | Program
Manager, Economic Empowerment Coordinator |
-Program
Management Team Donors/Fundin g Agencies -Ministry of Health -Stakeholder Meetings -Program Website -Annual Reports -M&E Database |
||
| SO 5.2: Raise awareness on HIV prevention care and treatment among youths, Men and Women | |||||||||||||
| 5.2.1:
Organize workshops, seminars, and training sessions on HIV prevention, care, and treatment.
|
No. of workshops, seminars, and training sessions conducted | The total no. of workshops, seminars, and training sessions organized and conducted by the program on HIV prevention, care, and treatment | Workshop, seminar, and training session records
Participant registration forms Evaluation forms and feedback surveys Program reports |
0 | 10 | 2 | 2 | 2 | 2 | 2 | Quarterly: Progress reports
Bi-annually: In-depth reports Annually: Comprehens ive report |
Coordinator
Officers |
Program
Management Team Donors/Fundin g Agencies Stakeholder Meetings. Program Website
|
| No. of participants trained on HIV prevention, | The total no. of individuals who have received training on HIV prevention, care, and treatment | Training records and reports | 0 | 500 | 100 | 100 | 100 | 100 | 100 | Quarterly: Progress reports |
Coordinator: |
– Program
Management Team -Donors |
|
| care, and treatment | through workshops, seminars, and training sessions | Participant registration forms
Training evaluation forms and feedback surveys Program reports and monitoring data |
Bi-annually: In-depth reports
Annually: Comprehens ive report |
|
-Stakeholder Meetings
– Program Website |
||||||||
| Pre-and posttraining assessment s showing increased knowledge and awareness on HIV prevention, care, and treatment | The percentage increase in knowledge and awareness of participants on HIV prevention, care, and treatment, as measured by preand post-training assessments |
|
0 | 80% | 10% | 20% | 20% | 20% | 20% | Quarterly: Progress reports
Bi-annually: In-depth reports Annually: Comprehens ive report |
|
Management Team -Donors -Stakeholder Meetings
Website |
|
| Evaluation forms from participants
indicating improved skills and capacity on HIV prevention, care, and treatment |
The percentage of participants who report improved skills and capacity on HIV prevention, care, and treatment, as measured by evaluation forms | Participant evaluation forms
– Training records and reports Feedback and survey data |
Comprehens ive report |
||||||||||
| No. of healthcare providers and community workers applying new skills and | Percentage of healthcare providers and community
workers who apply new skills and knowledge learned from training sessions |
– Follow-up surveys and interviews with healthcare providers and | 90% | 10% | 20% | 20% | 20% | 20% |
|
Coordinator
|
Program
Management Team – Donors/Fundin g Agencies |
| knowledge on HIV prevention, care, and treatment | in their daily
work |
community workers
– Supervision and mentoring reports
|
– Annually:
Comprehens ive report |
|
–
Stakeholder Meetings
Health |
||||||||
| 5.2.2
Conduct HIV awareness campaigns targeting 50000 youths, men, and women through social media, schools, and community events. |
No. of people reached
through social media |
The total no. of individuals who have viewed, shared, or engaged with social media content related to HIV prevention, care, and treatment |
analytics tools (e.g. Insights, Analytics)
comments) |
0 | 20,000 | 4000 | 4000 | 4000 | 4000 | 4000 | Program
Manager
Media Officer:
Officer:
|
Comprehensive report |
Management Team – Donors/Fundin g Agencies – Stakeholder Meetings
|
| No. of schools and community events participate
d in for HIV prevention, care, and treatment |
The total no. of schools and community events where program staff and volunteers participate to raise awareness and provide education on HIV prevention, care, and treatment |
|
0 | 100 | 20 | 20 | 20 | 20 | 20 | Quarterly: Progress reports
Comprehens ive report |
Campaign Officer
Officers |
||
| No. of people attending awareness campaigns on HIV prevention, | The total no. of individuals who attend awareness campaigns, events, and
activities organized by the |
Attendance records and sign-in sheets
– Event reports and evaluations |
0 | 30,000 | 6000 | 6000 | 6000 | 6000 | 6000 | Quarterly: Progress reports
– Bi-annually: In-depth reports |
– Program
Management Team – Donors/Fundin g Agencies |
| care, and treatment | program to raise awareness and provide education on HIV prevention, care, and treatment | – Program monitoring data | – Annually:
Comprehens ive report |
–
Stakeholder Meetings
|
|||||||||
| Pre-and postcampaign assessment s showing increased knowledge and awareness on HIV prevention, care, and treatment | The percentage increase in knowledge and awareness of individuals attending awareness campaigns, as measured by preand postcampaign assessments |
|
0 | 70% | 15% | 15% | 10% | 10% | 10% |
Comprehens ive report |
program Manager
Campaign Officer:
Program Officers: |
Management Team – Donors/Fundin g Agencies – Stakeholder Meetings
|
|
| Evaluation forms from participants
indicating improved attitudes and behaviors |
The percentage of participants who report improved attitudes and behaviors related to HIV prevention, care, and treatment, as measured by evaluation forms |
|
0 | 80% | 20% | 20% | 20% | 20% | 20% |
Comprehens ive report |
– Program
Manager: – Awareness Campaign Officer: – M&E Officer- Program Officers: |
||
|
5.2.3: 60 Radio talk Shows on HIV/AIDS prevention, care and |
No. of radio talk shows conducted on HIV prevention, | The total no. of radio talk shows organized and conducted by the program to raise awareness and provide education on HIV | – Radio talk show records and reports | 0 | 60 | 12 | 12 | 12 | 12 | 12 |
|
Communicatio n Officer: Organizing and conducting
radio talk shows |
Management Team |
| Treatment and stigma | care, and treatment | prevention, care, and treatment | – Program monitoring data | – Annually:
Comprehens ive report |
–
Donors/Fundin g Agencies
– Stakeholder Meetings
Website |
||||||||
| No.of listeners reached through
radio talk shows on HIV prevention, care, and treatment |
The total no. of listeners who tune in to radio talk shows organized by the program to raise awareness and provide education on HIV prevention, care, and treatment |
|
Comprehens ive report |
Communicatio n Officer: Organizing and conducting
radio talk shows |
Management Team – Donors/Fundin g Agencies |
||||||||
| Feedback from
listeners indicating increased knowledge and awareness on HIV prevention, care, and treatment |
The percentage of listeners who provide feedback
indicating increased knowledge and awareness on HIV prevention, care, and treatment after listening to radio talk shows |
|
0 | 80% | 10% | 20% | 20% | 20% | 10% | Quarterly: Progress reports | Communicatio
n Officer |
Management Team – Donors/Fundin g Agencies |
|
| Reduction in stigma and discriminati on against People
Living with |
The percentage reduction in stigma and discrimination against PLHIV, as measured by | – Surveys and
questionnaire s administered to the general |
0 | 20% | 4% | 4% | 4% | 4% | 4% | Bi-annually: In-depth reports | Stigma
Reduction Officer: Implementing stigma reduction activities |
-Bi-annual reports to:
– Stakeholder Meetings |
| HIV
(PLHIV) |
surveys and focus groups | public and PLHIV
|
– Program
Website |
||||||||||
| No. of calls and messages received during
radio talk shows on HIV prevention, care, and treatment |
The total no. of calls and messages received during radio talk shows,
indicating audience engagement and interest in HIVrelated topics |
station call-in and message logs
|
0 | 500 per radio show | 500×12 | 500×12 | 500×12 | 500×12 | 500×12 |
Comprehens ive report |
Communicatio
n Officer |
||
| 5.2.4
Implement Quarterly anti-stigma campaigns through social media and community events |
No. of participants in quarterly anti-stigma campaigns through social media and community events |
The total no. of participants in anti-stigma campaigns conducted through social media and
community events, indicating reach and engagement |
analytics tools (e.g. Insights, Analytics)
|
0 | 500 per quarter | 2000 | 2000 | 2000 | 2000 | 2000 |
Comprehens ive report |
–
Communicatio n Officer: Implementing social media campaigns – Community Outreach Officer: Organizing community events |
Management Team – Donors/Fundin g Agencies
– Stakeholder Meetings
Website
|
| 5.2.5
Develop and distribute youthfocused HIV/AIDS informatio n materials (e.g., brochures, posters) to 10000 individuals
|
No. of youthfocused HIV/AIDS information materials distributed to individuals | The total no. of youth-focused HIV/AIDS information materials (e.g. brochures, posters) distributed to individuals, indicating reach and dissemination of information | –
Distribution records and reports – Program monitoring data |
0 | 10,000 | 2000 | 2000 | 2000 | 2000 | 2000 |
Comprehens ive report |
–
Communicatio n Officer: Developing and designing materials – Outreach Officer: Distributing materials to youth |
:
Management Team – Donors/Fundin g Agencies Stakeholder Meetings
Website
|
| 5.2.6
Engage influencers, celebrities, and community leaders to champion HIV awareness
|
No. of influencers,
celebrities, and community leaders partnered to champion HIV awareness |
he total no. of influencers, celebrities, and community
leaders identified and partnered with to champion HIV awareness, indicating reach and influence |
analytics tools (e.g. follower count, engagement metrics) |
0 | 10 | 2 | 2 | 2 | 2 | 2 |
Comprehens ive report |
–
Communicatio n Officer: Identifying and partnering with influencers – Outreach Officer: Building relationships with community leaders |
Program Management Team & Donors/Fundin g Agencies
Stakeholder Meetings& Program Website Annual comprehensive |
| THEMATIC AREA 2: TB & LEPROSY. | |||||||||||||
| SO5.3 To Create Awareness about Tb and contribute to increased proportion of people with Tb symptoms that seek appropriate care from health facilities | |||||||||||||
| 5.3.1
Conduct 75 community -based sensitizatio n sessions |
No. of community
-based sensitizatio n sessions conducted |
The total no. of community-based sensitization sessions conducted for community/instit | – Session attendance records and reports | 0 | 75 | 15 | 20 | 15 | 15 | 10 | Quarterly: Progress reports
|
Community
Outreach Officer: Organizing and |
– Quarterly progress reports to: |
| for
3750comm unity/instit utional leaders on TB prevention, control, and stigma reduction in 15 selected subcounties/di visions of greater jinja. |
for
community /institution al leaders on TB prevention, control, and stigma reduction |
utional leaders on TB prevention, control, and stigma reduction,
indicating reach and engagement |
– Program monitoring data | conducting sessions | – Program
Management Team – Donors/Fundin g Agencies |
||||||||
| No. of community
/institution al leaders sensitized on TB prevention, control, and stigma reduction |
The total no. of community/instit
utional leaders who have received sensitization on TB prevention, control, and stigma reduction, indicating reach and engagement |
|
Comprehens ive report |
Community
Outreach Officer: Organizing and conducting sessions |
Management Team – Donors/Fundin g Agencies
– Stakeholder Meetings
Website
|
||||||||
| 5.3.2
Collaborat e with 10 public health facilities and 5 CSOs to implement the CAST+ Campaign screening, and sputum collection |
No. of public
health facilities and CSOs partnered with |
The total No. of public health
facilities and CSOs partnered with to support TB prevention, control, and stigma reduction efforts, indicating collaboration and leverage |
|
0 | 15 | 3 | 3 | 3 | 3 | 3 |
Comprehens ive report |
Partnership Officer:
Establishing and maintaining partnerships |
Management Team – Donors/Fundin g Agencies
– Stakeholder Meetings
Website |
| No. of individuals screened for TB | The total no. of individuals who have received TB screening, indicating reach and coverage of TB detection efforts |
records |
0 | 10000 | 2000 | 2000 | 2000 | 2000 | 2000 | Quarterly | TB Screening Officer:
Implementing TB screening activities |
Management Team – Donors/Fundin g Agencies |
|
| No.
of sputum samples collected |
The total no. of sputum samples collected from individuals suspected of having TB, indicating the coverage and effectiveness of TB diagnostic efforts |
|
0 | 5000 | 1000 | 1000 | 1000 | 1000 | 1000 | Quarterly: Progress reports | TB Diagnostic Officer:
Implementing sputum sample collection and testing
|
Program
Management Team – Donors/Fundin g Agencies |
|
| SO5.4 To conduct Tb contact tracing to index Tb patients and contribute to increased Tb preventive therapy (TPT) uptake among eligible Contacts under 5 and 5+ yrs. | |||||||||||||
| 5.4.1:
Implement Tb Contact tracing and TPT Initiation |
No. of TB contacts traced and
initiated on TPT (Tuberculo sis Preventive Treatment) |
The total no. of contacts of TB patients who have been traced and initiated on TPT, indicating the effectiveness of TB prevention efforts |
initiation records and reports
|
0 | 500 | 100 | 100 | 100 | 100 | 100 |
Comprehens ive report |
Tracing Officer: Implementing contact tracing activities
Implementing TPT initiation activities |
|
| – Health facility
records |
|||||||||||||
| 5.4.2:
Conduct quarterly Training sessions for 10 ROCAF staffs and 20 volunteers on Integrated TB/Leprosy Manageme nt (ICTLM) and contact tracing. |
No. of training sessions conducted | The total no. of training sessions conducted for healthcare workers, community health workers, and other stakeholders on TB prevention, detection, and treatment, indicating the capacity building efforts |
|
0 | 5 | 1 | 1 | 1 | 1 | 1 | Quarterly: Progress reports | Training Officer: Organizing and conducting training sessions |
Management Team – Donors/Fundin g Agencies |
| No. of
ROCAF staff trained |
The total no. of ROCAF staff trained on TB prevention, detection, and treatment, indicating the capacity building efforts | -Training records and reports
|
0 | 10 | 2 | 2 | 2 | 2 | 2 |
Comprehens ive report |
Training Officer: Organizing and conducting training sessions |
Management Team – Donors/Fundin g Agencies – Stakeholder Meetings
Website
|
|
| No. of volunteers trained | The total no. of volunteers trained on TB prevention, detection, and treatment, indicating
community engagement and capacity building efforts |
|
– Quarterly progress reports t |
|
Management Team – Donors/Fundin g Agencies |
| – Volunteer registration records | |||||||||||||
| SO5.5 To Strengthen Public Private Mix (PPM) for TB | |||||||||||||
| 5.5.1 Train
250 Health Workers in private Health facilities on Public private Mix (PPM) |
No. of health workers in private
health facilities trained on PPM |
The total no. of health workers in private health
facilities trained on PPM, indicating the capacity building efforts to engage private sector in TB care |
-Training records and reports
|
Comprehens ive report |
Engagement Officer: Managing private health facility engagement |
Program Management Team&Donors/ Funding Agencies
Stakeholder Meetings
|
|||||||
| 5.5.2 Equip 15 Private clinics with
HMIS tools, ICF, Sputum mugs and Gene Xpert Request forms |
No. of Private clinics
equipped with HMIS tools and materials |
The total no. of private clinics equipped with HMIS tools and materials, indicating the capacity to collect and report quality TB data |
|
0 | 15 | 3 | 3 | 3 | 3 | 3 | Annually:
Comprehens ive report |
Distributing HMIS tools and materials
Engagement Officer: Managing private clinic engagement |
Health – Donors/Fundin g Agencies
Website |
| No. of HMIS tools and materials distributed | The total no. of HMIS tools and materials distributed to private clinics, indicating the support provided to enhance TB |
|
0 | 150 | 30 | 30 | 30 | 30 | 30 | – Annually:
Comprehens ive report |
Distributing HMIS tools and materials
Managing |
Annual comprehensive report to:
– Ministry of Health |
|
| data collection and reporting | – Private clinic registration records | delivery and storage | –
Donors/Fundin g Agencies – Program Website |
||||||||||
| 5.5.3
Supportive supervision and mentorship to 20 clinics in PPM |
No. of clinics receiving supportive supervision and mentorship in Public-
Private Mix (PPM) |
The total no. of clinics receiving supportive supervision and mentorship in PPM, indicating the quality
improvement support provided to enhance TB care |
Supervision &mentorship
records ,Clinic registration records Site visit reports – Feedback forms from clinics |
Annually |
Improvement Officer: Providing supervision and mentorship
Coordinator: Managing PPM clinic engagement |
– Donors/Fundin g Agencies
Website |
|||||||
| THEMATIC AREA 3: MALARIA | |||||||||||||
| SO5.6 To contribute to reduced Malaria infections and Zero deaths in greater Jinja | |||||||||||||
| 5.6.1Engag ement of 1000 community
stakeholder s in the sub- counties of Jinja on Malaria prevention
|
No.of community stakeholde rs engaged in Malaria
prevention in Jinja subcounties |
The total no. of community stakeholders (community leaders, volunteers, and residents) engaged in Malaria
prevention activities in Jinja sub-counties, indicating community involvement and awareness |
|
0 | 1000 | 200 | 200 | 200 | 200 | 200 |
Comprehens ive report |
Engagement Officer: Leading engagement activities
Prevention Specialist: Providing technical guidance |
Management Team – Donors/Fundin g Agencies
– Stakeholder Meetings
Website |
Health – Donors/Fundin g Agencies
Website |
|||||||||||||
| 5.6.2
Conduct Integrated Outreaches in collaborati on with public Health facilities on Malaria Test and Treatment in 100 Villages with highest Malaria cases |
No. of villages
reached with Integrated Outreache s |
The total no. of villages that receive integrated outreaches, including Malaria testing, treatment, and prevention services, indicating the geographic coverage and reach of the program. |
or maps to verify village locations |
0 | 100 | 20 | 20 | 20 | 20 | 20 | Quarterly: Progress reports | Outreach Coordinator: Leading outreach
activities |
Management Team – Donors/Fundin g Agencies |
| No. of individuals tested for Malaria | The total no. of individuals who receive Malaria testing services, indicating the program’s coverage and reach in detecting Malaria cases. |
|
10,000 | 2000 | 2000 | 2000 | 2000 | 2000 | Quarterly: Progress reports | Malaria Testing Coordinator: Overseeing
testing activities |
Management Team – Donors/Fundin g Agencies |
||
| No. of individuals treated for
Malaria |
The total no. of individuals who receive Malaria treatment services, indicating the program’s | – Malaria treatment records (treatment registers, patient cards) | 0 | 3000 | 600 | 600 | 600 | 600 | 600 | Quarterly: Progress reports | Malaria Treatment Coordinator: Overseeing treatment activities |
Management Team |
| coverage and reach in treating Malaria cases. |
|
–
Donors/Fundin g Agencies |
|||||||||||
| 5.6.4 Train 100 VHTs and 50 Health
Assistants on ICCM of malaria diagnosis, treatment, and prevention community in Selected sub counties with high Malaria burden |
No. of
VHTs and Health Assistants trained on ICCM of malaria diagnosis, treatment, and prevention |
The total no. of
VHT members and Health Assistants trained on Integrated Community Case Management (ICCM) of malaria diagnosis, treatment, and prevention, indicating the program’s capacity building efforts to enhance community-level Malaria services. |
|
|
20
10 |
20
10 |
20
10 |
20
10 |
20
10 |
Quarterly | Training Coordinator: Leading training activities |
Management Team – Donors/Fundin g Agencies |
|
|
5.6.4 Facilitate 100 VHT to do House hold Communit y Identificati on of Children under Five with Fever, and Refer to health facility |
No. of VHTs
trained and facilitated |
The total No. of VHT members
trained and facilitated to provide ICCM services, including malaria diagnosis, treatment, and prevention, indicating the program’s capacity building efforts to enhance community-level health services. |
|
0 | 100 | 20 | 20 | 20 | 20 | 20 | Quarterly: Progress reports |
Supervisor: Facilitating VHTs |
Management Team – Donors/Fundin g Agencies |
| No. of households
visited by VHTs |
The total no. of households visited by VHT
members, indicating the program’s reach and coverage of community-level health services. |
visitation records (household visit reports, VHT logbooks)
verify household locations |
0 | 5000 | 1000 | 1000 | 1000 | 1000 | 1000 | Quarterly | VHT
Supervisor: Overseeing VHT activities |
Management Team – Donors/Fundin g Agencies |
|
| No. of children under five identified with fever | The total no. of children under five years old
identified with fever by VHT members during household visits, indicating the program’s ability to detect and manage fever cases among vulnerable populations. |
visitation records (fever case identification forms, VHT logbooks)
|
0 | 15000 | 3000 | 3000 | 3000 | 3000 | 3000 | Quarterly | VHT
Supervisor: Overseeing VHT activities |
Management Team – Donors/Fundin g Agencies |
|
| No. of children referred to
health facilities |
The total no. of children under five years old referred to
health facilities by VHT members for further diagnosis and treatment, indicating the program’s ability to ensure timely and appropriate care for |
referral records (referral forms, VHT logbooks)
records (outpatient registers, admission records) |
0 | 1200 | 240 | 240 | 240 | 240 | 240 | Quarterly | VHT
Supervisor: Overseeing VHT activities |
Management Team – Donors/Fundin g Agencies |
| vulnerable populations. | – Household registration forms | ||||||||||||
| 5.6.5 Map 100 Villages with highest Malaria cases, and Conduct
sensitizatio n campaigns on malaria prevention (Malaria GO Campaign) in these villages to Change Mind sets of communiti es |
No. of villages
mapped |
The total no. of villages mapped to identify highrisk areas, households, and individuals, indicating the program’s ability to target interventions effectively. |
mapping records (maps, GPS coordinates)
|
0 | 100 | 20 | 20 | 20 | 20 | 20 | Quarterly: Progress reports | -Field Staff:
Conducting village mapping |
Management Team – Donors/Fundin g Agencies |
| No. of sensitizatio n campaigns conducted | The total no. of
sensitization campaigns conducted to raise awareness about Malaria prevention and treatment, indicating the program’s ability to promote behavioral change and community engagement. |
–
Sensitization campaign records (campaign reports, attendance sheets)
engagement logs
|
0 | 100 | 20 | 20 | 20 | 20 | 20 | Quarterly | Community
Engagement Officer: Leading sensitization campaigns |
Management Team – Donors/Fundin g Agencies |
| No. of community members reached | The total no. of community members reached through sensitization campaigns, indicating the
program’s ability to promote awareness and behavioral change among the target population. |
–
Sensitization campaign records (attendance sheets, participant lists)
engagement logs
|
0 | 10000 | 2000 | 2000 | 2000 | 2000 | 2000 | Quarterly | Community
Engagement Officer: Leading sensitization campaigns |
Management Team – Donors/Fundin g Agencies |
|
| 5.6.6
Conduct house-tohouse assessment s and Engage 1000 households in improving their homestead s, Identify and remove breeding places for mosquitoes to prevent malaria. |
No. of households assessed | The total no. of households assessed to identify Malaria risk factors, indicate the program’s ability to target interventions effectively. |
|
0 | 1000 | 200 | 200 | 200 | 200 | 200 | Quarterly | Field Staff:
Conducting household assessments |
Management Team – Donors/Fundin g Agencies |
| No. of households engaged in improving
their homestead s |
The total no. of households that have taken actions to improve their homesteads to prevent Malaria, indicating the program’s ability to promote behavioral change and community engagement. |
|
0 | 1000 | 200 | 200 | 200 | 200 | 200 | Quarterly | Community
Engagement Officer: Leading household engagement |
Management Team – Donors/Fundin g Agencies |
| No. of mosquito breeding places identified and removed | The total no. of mosquito breeding places
identified and removed, indicating the program’s ability to prevent Malaria through vector control. |
(identificatio n forms, GPS coordinates)
|
0 | 5000 | 1000 | 1000 | 1000 | 1000 | 1000 | Quarterly |
Management Team – Donors/Fundin g Agencies |
Management Team – Donors/Fundin g Agencies |
|
| 5.6.7 Reorient 100 parish and sub-county leaders to establish task forces to coordinate malaria
activities and monitor progress on malaria prevention and control |
No. of parish and sub-county leaders reoriented | The total no. of parish and subcounty leaders re-oriented on their roles and responsibilities in Malaria prevention and control, indicating the program’s ability
to strengthen community leadership and ownership. |
|
0 | 100 | 20 | 20 | 20 | 20 | 20 | Quarterly | Community
Engagement Officer: Leading re-orientation efforts |
Management Team – Donors/Fundin g Agencies |
| No. of task forces established | The total no. of task forces established at the parish and subcounty levels to coordinate Malaria prevention and control activities, indicating the program’s ability to strengthen community-level coordination and response. |
|
0 | 100 | 20 | 20 | 20 | 20 | 20 | Quarterly | Community Engagement Officer:
Supporting task force establishment |
Management Team – Donors/Fundin g Agencies |
|
5.6.8 Conduct Assessmen t of 5000 Homes for Malaria free House (SMART Homes) |
No. of homes assessed | The total no. of homes assessed for Malaria risk factors, indicating the program’s ability to identify and target highrisk areas for interventions. |
|
0 | 5000 | 1000 | 1000 | 1000 | 1000 | 1000 | Q
uarterly |
Field Staff:
Conducting home assessments |
Management Team – Donors/Fundin g Agencies |
| No. of homes meeting
SMART Homes criteria |
The total no. of homes that meet the SMART
Homes criteria, indicating the program’s ability to improve home environments to prevent Malaria. |
assessment records (assessment forms, household registers)
confirming SMART Homes criteria met |
0 | 3000 | 600 | 600 | 600 | 600 | 600 | Quarterly: | Field Staff:
Conducting SMART Homes assessments |
Management Team – Donors/Fundin g Agencies |
|
| No. of homes
receiving recommen dations for improveme nt |
The total no. of homes that
receive recommendation s for improvement to meet SMART Homes criteria, indicating the program’s ability to identify areas for improvement in home environments to prevent Malaria. |
– Home assessment records (assessment forms, household registers)
– Recommend ation forms provided to households |
0 | 2000 | 400 | 400 | 400 | 400 | 400 | Quarterly | Field Staff:
Conducting home assessments and providing recommendatio ns |
Management Team – Donors/Fundin g Agencies |
|
| 5.6.8
Conduct 560 weekly Radio Talk |
No. of weekly Radio Talk shows on | The total no. of weekly Radio Talk shows conducted to | – Radio Talk show records (broadcast | 0 | 560 | 115 | 115 | 115 | 115 | 100 | Weekly:
Radio Talk |
Radio Talk show Host: Leading the | – Quarterly progress reports to: |
| shows on Malaria | Malaria conducted | educate and raise awareness about Malaria prevention and control. | schedules, audio recordings)
– Listener engagement data (phone calls, texts, social media interactions) |
show broadcast | discussions and interviews | – Program
Management Team – Donors/Fundin g Agencies |
|||||||
| 5.6.9
Conduct trainings to 200 Health workers and other players on MAAM & HAAM |
No. of Health workers and other players
trained on MAAM & HAAM |
The total no. of Health workers and other players trained on Malaria Case
Management (MAAM) and Home and Community Management of Malaria (HAAM), indicating the program’s ability to build capacity for Malaria diagnosis, treatment, and prevention. |
|
0 | 200 | 50 | 50 | 40 | 40 | 20 | Annually:
Comprehens ive report |
Training
Officer: Leading training sessions |
Health – Donors/Fundin g Agencies
Website |
| 5.6.10
Capacity building of a multidisciplinary team at 50 private and 30 public facilities on Integrated Case manageme nt of Malaria |
No. of private and
public facilities with multidisciplinary teams trained on Integrated Case Manageme nt of Malaria |
The total no. of private and public facilities with multi-disciplinary teams trained on Integrated Case
Management of Malaria, indicating the program’s ability to build capacity for comprehensive Malaria diagnosis, treatment, and prevention. |
assessment records (pre- and posttraining assessments) |
0 |
|
10
6 |
10
6 |
10
6 |
10
6 |
10
6 |
Annually:
Comprehens ive report |
Training
Officer: Leading training sessions |
Health – Donors/Fundin g Agencies
Website |
| 5.6.11 Support supervision | No. of
Health Facilities |
The total no. of Health Facilities receiving support | – Support supervision and | 0 | 80 | 20 | 20 | 20 | 10 | 10 | Annually:
Comprehens ive report |
Mentorship
Officer: Leading support |
– Annual comprehensive report to: |
| and Mentorship of 80
Health Facilities on Malaria Manageme nt practices. |
receiving support supervision and mentorship
on Malaria Manageme nt practices |
supervision and mentorship on Malaria
Management practices, indicating the program’s ability to strengthen Malaria diagnosis, treatment, and prevention at facility level. |
mentorship records (visit reports,
mentorship logs) – Facility assessment records (pre- and postmentorship assessments) |
supervision and mentorship |
Health – Donors/Fundin g Agencies
Website |
||||||||
| THEMATIC AREA 4: NUTRITION & WASH | |||||||||||||
| 5.7 Improve access to safe water, sanitation, and hygiene (WASH) facilities and promote good nutrition practices among vulnerable populations, particularly children and women. | |||||||||||||
| 5.7.1
Conduct Communit y HH WASH/Nut rition Assessmen t (MUAC) for 2500 Children, 500 Pregnant Women in 5000 HHs |
No. of households assessed | The total no. of households assessed for Malaria risk factors, indicating
the program’s ability to identify and target highrisk areas for interventions. |
|
0 | 5000 | 1000 | 1000 | 1000 | 1000 | 1000 | Quarterly: Progress reports | Field Staff:
Conducting household assessments |
Management Team – Donors/Fundin g Agencies |
| No. of children assessed | The total no. of children assessed for Malaria risk factors, indicating
the program’s ability to identify and target highrisk areas for interventions. |
|
0 | 2500 | 500 | 500 | 500 | 500 | 500 | Quarterly: Progress reports | Field Staff:
Conducting child assessments |
Management Team – Donors/Fundin g Agencies |
|
|
5.7.2 Linkage of 500 MAM & SAM to Health Centers for Out- patient Treatment centers (OTC) and In-patient Treatment Centers (ITC). |
No. of
MAM & SAM cases linked to Health Centers for OTC and ITC |
The total No. of
Moderate Acute Malnutrition (MAM) and Severe Acute Malnutrition (SAM) cases linked to Health Centers for Outpatient Treatment centers (OTC) and In-patient Treatment Centers (ITC), indicating the program’s ability to ensure timely and appropriate treatment for malnourished children. |
(OTC and ITC admission records)
records (MAM and SAM case registers) |
500 | 100 | 100 | 100 | 100 | 100 | 100 | Quarterly: Progress reports | Nutrition Officer:
Coordinating referrals and treatment |
Management Team – Donors/Fundin g Agencies |
| 5.7.3
Implement nutrition education and counseling program in 15 subcounties/ divisions |
No. of subcounties/di visions with implement ed nutrition education and counseling program | The total no. of subcounties/divisions where a nutrition education and counseling program has been implemented, indicating the
program’s ability to promote healthy nutrition practices and behaviors. |
|
0 | 15 | 5 | 5 | 5 | 5 | 5 | Quarterly: Progress reports | Nutrition Officer: Leading nutrition education and counseling program implementation |
Management Team – Donors/Fundin g Agencies |
| No. of community health workers and volunteers trained | The total no. of community health workers and volunteers trained to support nutrition education and counseling,
Malaria |
|
o | 300 | 60 | 60 | 60 | 60 | 60 | Quarterly: Progress reports | Training
Officer: Leading training sessions |
Management Team |
| prevention and control, and other health programs, indicating the program’s ability
to build capacity for communitylevel health promotion. |
volunteer registers | –
Donors/Fundin g Agencies |
|||||||||||
| No. of community outreach and education sessions conducted | The total No. of community outreach and education sessions conducted to promote healthy behaviors, disease prevention, and health-seeking behaviors, indicating the program’s ability to engage with and educate the community. |
|
0 | 150 | 30 | 30 | 30 | 30 | 30 | Quarterly: Progress reports | Community
Engagement Officer: Leading outreach and education sessions |
Management Team – Donors/Fundin g Agencies |
|
| 5.7.4
Conduct Pre trigger and Trigger sessions on sanitation Improveme nt in 40 villages and follow up of HHs with um improved and No Latrines for Sanitation Improveme |
No. of villages with conducted Pre-trigger and Trigger sessions | The total no. of villages where Pre-trigger and Trigger sessions have been conducted to prepare communities for potential health emergencies and respond to emerging health threats, indicating the program’s
ability to enhance community resilience. |
|
0 | 40 | 10 | 10 | 10 | 5 | 5 | Quarterly: Progress reports | Community
Engagement Officer: Leading Pre-trigger and Trigger session |
Management Team – Donors/Fundin g Agencies |
| nt 1.
Conducted Pre- |
No. of households identified
with unimprove d or no latrines |
The total no. of households
identified as having unimproved or no latrines, indicating the program’s ability to assess and address sanitation needs. |
(sanitation surveys, household registers)
|
0 | 1000 | 200 | 200 | 200 | 200 | 200 | Quarterly: Progress reports | Sanitation
Officer: Leading household assessments and latrine inspections |
Management Team – Donors/Fundin g Agencies |
| No. of households that have
improved their sanitation facilities |
The total No. of households that have improved their sanitation
facilities, such as constructing or upgrading latrines, indicating the program’s ability to support household-level sanitation improvements. |
(sanitation surveys, household registers)
– Improvement verification records |
0 | 800 | 200 | 200 | 200 | 100 | 100 | Quarterly: Progress reports | Sanitation
Officer: Leading household assessments, latrine inspections, and improvement verification |
Management Team – Donors/Fundin g Agencies |
|
| 5.7.5 Rehabilitat e 500
latrines and promote proper waste disposal |
No. of latrines rehabilitate d and promoting proper waste disposal | The total no. of latrines rehabilitated and households promoting proper waste disposal, indicating the program’s ability to improve sanitation infrastructure and practices. |
practices, knowledge, and attitudes) CLTS monitoring records |
0 | 500 | 100 | 100 | 100 | 100 | 100 | Quarterly: Progress reports | Sanitation Officer: Leading latrine rehabilitation and waste disposal promotion |
Management Team – Donors/Fundin g Agencies |
| 5.7.6
Conduct hygiene promotion campaigns in 15 subcounties/di visions of greater jinja |
No. of subcounties/di visions with conducted hygiene promotion campaigns | The total no. of subcounties/divisions where hygiene promotion campaigns have been conducted, indicating the
program’s ability to promote healthy hygiene practices. |
|
0 | 15 | 3 | 3 | 3 | 3 | 3 | Quarterly: Progress reports | ||
| No. of community members reached with hygiene messages | The total no. of community
members who have received hygiene messages through various channels, indicating the program’s ability to promote healthy hygiene practices. |
activity records (event reports, attendance sheets)
|
0 | 30000 | 6000 | 6000 | 6000 | 6000 | 6000 | Quarterly: Progress reports | Hygiene
Promotion Officer: Leading hygiene messaging activities |
Management Team – Donors/Fundin g Agencies |
|
| 5.7.7 Distribute hygiene materials (soap, toothbrush
es, etc.) 500 vulnerable households. |
No. of vulnerable households receiving hygiene materials | The total no. of vulnerable households that have received hygiene materials, such as soap, toothbrushes, and other essential items, indicating the program’s ability | –
Distribution records (household receipts, distribution reports) – Household surveys (hygiene |
0 | 500 | 100 | 100 | 100 | 100 | 100 | Quarterly: Progress reports | Hygiene
Promotion Officer: Leading distribution activities |
Management Team – Donors/Fundin g Agencies |
| to support household-level hygiene practices. | practices, material usage)
– Vulnerability assessment records (targeting vulnerable households |
||||||||||||
| 5.7.8
Establish handwashin g stations and promote handwashin g practices in 200 Trading centres of villages in jinja. |
No. of trading centers with
established handwashin g stations and promoted handwashin g practices |
The total no. of trading centers in
villages in Jinja where handwashing stations have been established and handwashing practices have been promoted, indicating the program’s ability to improve public health hygiene. |
Handwashing station establishmen t records (photos, reports)
Handwashing promotion activity records (event reports, attendance sheets)
|
0 | 200 | 40 | 40 | 40 | 40 | 40 | Quarterly: Progress reports | Hygiene
Promotion Officer: Leading handwashing station establishment and promotion |
Management Team – Donors/Fundin g Agencies |
| 5.7.9 Inspection of Water Sources and Capacity building of 100 Water and Sanitation
Committee s |
No. of water sources inspected and Water and Sanitation
Committee s (WSCs) with capacity building |
The total no. of water sources inspected for
safety and quality, and WSCs that have received capacity building training, indicating the program’s ability to improve water management and governance. |
capacity building records (training attendance, evaluation forms)
|
|
20
20 |
20
20 |
20
20 |
20
20 |
20
20 |
Quarterly: Progress reports |
Building Officer: Leading WSC capacity building |
Management Team – Donors/Fundin g Agencies |
|
| 5.7.10 Rehabilitat e 100 | No. of boreholes, wells, and | The total no. of boreholes, wells, and water | –
Rehabilitatio n records |
100 boreholes, wells, and | 20 | 20 | 20 | 20 | 20 | Quarterly: Progress reports | Water and Sanitation Engineer: | – Quarterly progress reports to: |
| boreholes, wells, and water storage facilities.
5.7.11 Install 100 water treatment systems and distribute water purification tablets 5000 households 1. Installed 100 water treatment systems in communiti es |
water storage
facilities rehabilitate d |
storage facilities rehabilitated to improve access to safe and reliable water sources, indicating the program’s ability to enhance water infrastructure. | (before-andafter photos, technical reports)
)
|
water storage
facilities rehabilitated |
Leading rehabilitation activities | – Program
Management Team – Donors/Fundin g Agencies |
|||||||
| No. of water treatment systems installed | The total no. of water treatment systems installed to provide safe and clean drinking water, indicating the program’s ability to improve water quality. |
|
0 | 100 | 20 | 20 | 20 | 20 | 20 | Quarterly: Progress reports | Water and Sanitation Engineer: Leading installation activities |
Management Team – Donors/Fundin g Agencies |
|
| No. of households receiving water purification tablets | The total no. of households that have received water purification tablets to ensure access to safe drinking water, indicating the program’s ability to improve water quality. | –
Distribution records (household receipts, distribution reports)
|
0 | 5000 | 1000 | 1000 | 1000 | 1000 | 1000 | Quarterly: Progress reports | Water and
Sanitation Officer: Leading distribution activities |
Management Team – Donors/Fundin g Agencies |
| 5.7.12
Conduct annual Training workshops for 50 Jinja DWSCC members on WASH Governanc e |
No. of Jinja
DWSCC members trained on WASH Governanc e |
The total no. of
Jinja District Water and Sanitation Committee (DWSCC) members who have received training on Water, Sanitation, and Hygiene (WASH) governance, indicating the program’s ability to strengthen local governance |
meeting minutes and reports |
0 | 50 | 10 | 10 | 10 | 10 | 10 | Quarterly: Progress reports | Training
Officer: Leading training activities |
Management Team – Donors/Fundin g Agencies |
| 5.8.13
Support Quarterly meeting with 50 DWSCC members, including district/Cit y officials, NGOs, and community representat ives. |
No. of quarterly meetings held | The total no.of quarterly meetings held with 50 Jinja District Water and Sanitation
Committee (DWSCC) members, indicating the program’s ability to foster collaboration and coordination. |
coordinator’s records |
0 | 20 | 4 | 4 | 4 | 4 | 4 | Quarterly | DWSCC
Coordinator: Leading meeting organization and coordination |
Management Team – Donors/Fundin g Agencies |
| No.of
DWSCC members and stakeholde rs attending meetings |
The average no. of DWSCC members and stakeholders attending quarterly meetings, indicating the program’s ability to engage and mobilize key stakeholders. |
coordinator’s records |
0 | 1000 | 200 | 200 | 200 | 200 | 200 |
|
DWSCC
Coordinator: Leading meeting organization and coordination |
Management Team – Donors/Fundin g Agencies |
|
| THEMATIC AREA 5: GBV | |||||||||||||
| SO 5:9: Improve and increase the accessibility by 30% for victims to essential, specialist, safe and adequate multisectoral services
|
|||||||||||||
| 5.9.1
Provide training to 250 multisectoral service providers on victimcentered care, traumainformed approach and multisectoral collaborati on. |
No. of multisectoral service providers trained | The total no. of multi-sectoral service providers trained on victimcentered care, trauma-informed approach, and multi-sectoral collaboration, indicating the program’s ability to enhance service delivery. |
|
0 | 250 | 50 | 50 | 50 | 50 | 50 | Quarterly: Progress report | Training
Officer: Leading training activities |
Management Team – Donors/Fundin g Agencies |
| 5.9.2 Establish and run a
one-stop crisis Centre for victims of GBV that can avail 50 victims per day with Holistic services and 24/7 under one roof. |
No. of victims of
GBV served at the onestop crisis center |
The total no. of victims of
Gender-Based Violence (GBV) served at the one-stop crisis center, indicating the program’s ability to provide holistic support services. |
|
0 | 50 victims per day |
Comprehens ive report |
– Counselors/Soc ial Workers: Service provision
|
– Monthly progress reports to:
Program Management Team & Donors/Fundin g Agencies Quarterly reports to: Stakeholder Meetings & Program Website Annual comprehensive report to: Donors/Fundin g Agencies& Program Website |
|||||
| 5.9.3 Do Quarterly awareness raising campaigns to Educate
victims, communiti es, and service providers about available services and how to access them. |
No. of quarterly
awareness raising campaigns conducted |
The total no. of quarterly awareness raising campaigns conducted to educate victims, communities, and service providers about available services and how to access them, indicating the
program’s ability to promote knowledge and access to support. |
articles, social media posts)
|
0 | 20 | 4 | 4 | 4 | 4 | 4 |
|
Awareness
Raising Officer: Leading campaign organization and implementation |
Management Team – Donors/Fundin g Agencies |
| No. of people reached through campaigns | The total no. of people reached through quarterly awareness raising campaigns, indicating the
program’s ability to promote knowledge and access to support services. |
engagement rate)
|
0 | 10000 | 2000 | 2000 | 2000 | 2000 | 2000 |
|
Awareness
Raising Officer: Leading campaign organization and implementation |
Management Team – Donors/Fundin g Agencies |
|
| 5.9.4
Conduct Bi annual stakeholder ’s meetings with service providers, governmen t agencies, and community organizatio ns to |
No. of biannual stakeholde r meetings conducted | The total no. of bi-annual stakeholder meetings conducted with service providers, government
agencies, and community organizations, indicating the program’s ability to foster |
|
0 | 10 | 2 | 2 | 2 | 2 | 2 |
Comprehens ive report |
Coordination Officer: Leading meeting organization and facilitation | – Bi-annual progress reports to:
Program Management Team Donors/Fundin g Agencies Annual comprehensive report to: Donors/Fundin g Agencies |
| ensure a coordinate d response.
|
coordination and collaboration. | implementati on | Program Website | ||||||||||
| 5.9.5 Do service mapping by Creating and disseminati ng 10000 copies of a directory of available services, including specialist services, to victims and service providers. | No. of directories created and disseminate d | The total no. of directories created and disseminated to victims and service providers, indicating the program’s ability to increase access to information on available services. |
– Distribution records (no. of directories disseminated )
|
0 | 10000 | 2000 | 2000 | 2000 | 2000 | 2000 | Quarterly: Progress reports | Service
Mapping Officer: Leading directory creation and dissemination |
Quarterly progress reports to:
Program Management Team Donors/Fundin g Agencies |
| No. of victims accessing services using the directory | The total no. of victims who access services using the directory, indicating the program’s ability to increase access to support services. |
of clients accessing services using the directory)
|
0 | 500 | 100 | 100 | 100 | 100 | 100 | Quarterly: Progress reports | Service
Mapping Officer: Monitoring directory usage |
Management Team – Donors/Fundin g Agencies |
|
| SO5.10: Enhance an Improved prevention of GBV through changes in behavior, practices and attitudes | |||||||||||||
| 5.10.1 Behavior change programs targeting 1000 men and boys to transform harmful gender norms and behaviors | No. of men and boys participatin g in behavior change programs | The total no. of men and boys
participating in behavior change programs aimed at transforming harmful gender norms and behaviors, indicating the program’s ability to engage and influence key stakeholders. |
|
0 | 1000 | 200 | 200 | 200 | 200 | 200 | Quarterly: Progress reports | Behavior
Change Officer: Leading program implementation |
Management Team – Donors/Fundin g Agencies |
| No. of participants reporting reduced perpetratio n of GBV | The total no. of participants in behavior changes programs who report a reduction in perpetration of GBV, indicating
the program’s ability to influence positive behavior change. |
|
0 | 500 | 100 | 100 | 100 | 100 | 100 | Quarterly: Progress reports | Behavior
Change Officer: Leading program implementation |
Management Team – Donors/Fundin g Agencies |
|
| 5.10.2
Organize Quarterly community events, campaigns, and dialogues to raise awareness about GBV
|
No. of community events, campaigns, and dialogues held to
raise awareness about GBV |
The total no. of
community events, campaigns, and dialogues organized and implemented to raise awareness about GBV within the target community |
– Event reports, campaign monitoring forms, and dialogue evaluation reports | 0 | 20 | 4 | 4 | 4 | 4 | 4 | Quarterly | GBV
Awareness Program Coordinator |
|
| No. of community
members participatin g in GBV |
– The total no. of community
members who attend and participate in GBV awareness events, |
– Event attendance records, sign-in sheets, and participant | 0 | 2500 | 500 | 500 | 500 | 500 | 500 | Quarterly | – GBV
Awareness Program Coordinator |
| awareness events | campaigns, and dialogues | feedback forms | |||||||||||
| No. of community
members reporting changed attitudes and behaviors related to GBV |
The no. of community
members who self-report a change in their attitudes and behaviors related to GBV after participating in awareness events, campaigns, and dialogues |
Participant feedback forms, surveys, and focus group discussions | 0 | 1500 | 300 | 300 | 300 | 300 | 300 | Quarterly | GBV
Awareness Program Coordinator |
Quarterly
Progress Report (QPR) submitted to Donor/Stakehol ders |
|
| 5.10.3
Engage 225 Communit y, religious and traditional leaders to promote GBV prevention and support survivors in promoting nonviolence and gender equality. |
No. of community
, religious, and traditional leaders engaged to promote GBV prevention and support survivors |
The no. of community,
religious, and traditional leaders who are actively engaged and committed to promoting non-violence, gender equality, and supporting GBV survivors |
Leader engagement forms, meeting minutes, and progress reports | 0 | 225 | 45 | 45 | 45 | 45 | 45 | Quarterly | GBV Program
Coordinator |
Quarterly
Progress Report (QPR) submitted to Donor/Stakehol ders |
| No. of leaders
trained on GBV prevention and response |
The no. of community,
religious, and traditional leaders who receive training on GBV prevention, response, and support for survivors |
Training attendance records, participant
lists, and evaluation forms |
0 | 200 | 40 | 40 | 40 | 40 | 40 | Quarterly | GBV Program Coordinator | Quarterly
Progress Report (QPR) submitted to Donor/Stakehol ders |
|
| No. of leaders
actively promoting GBV |
The no. of community,
religious, and traditional leaders who |
Leader engagement forms, activity reports, and | 0 | 150 | 30 | 30 | 30 | 30 | 30 | Quarterly | GBV Program Coordinator | Quarterly
Progress Report (QPR) submitted to |
| prevention and support for survivors | actively promote GBV prevention, support survivors, and advocate for nonviolence and gender equality in
their communities |
community feedback | Donor/Stakehol ders | ||||||||||
| 5.10.4
Integrate GBV prevention into school curricula and extracurric ular activities in 100 primary schools. |
No. of schools with
integrated GBV prevention curricula |
The no. of primary schools that have integrated GBV prevention and response into their curricula and
extracurricular activities |
School curricula reviews, teacher training records, and school reports | 0 | 100 | 20 | 20 | 20 | 20 | 20 | Quarterly | GBV Program
Coordinator |
Quarterly
Progress Report (QPR) submitted to Donor/Stakehol ders |
| No. of. students reached through GBV
prevention curricula |
The no. of students who receive GBV prevention and response education through integrated curricula and extracurricular
activities in primary schools |
School attendance records, student participation reports, and teacher feedback | 0 | 30000 | 6000 | 6000 | 6000 | 6000 | 6000 | Quarterly | GBV Program Coordinator | Quarterly
Progress Report (QPR) submitted to Donor/Stakehol ders |
|
| No. of extracurric ular
activities focused on GBV prevention |
The no. of extracurricular activities, such as clubs, workshops, and events, that focus on GBV prevention and response, implemented in primary schools | School
activity reports, event records, and teacher feedback |
0 | 500 | 100 | 100 | 100 | 100 | Quarterl y | GBV Program Coordinator | Quarterly
Progress Report (QPR) submitted to Donor/Stakehol der |
||
| 5.10.5
Conduct 180 radio |
No. of radio talks conducted | The no.of radio talks shows, programs, or | Radio broadcast records, | 20 | 180 | 32 | 32 | 32 | 32 | 32 | Quarterly | GBV Program
Coordinator |
Quarterly
Progress Report (QPR) |
| talk to challenge harmful gender stereotypes and
promote positive attitudes. gender |
to challenge harmful gender stereotype
s and promote positive attitudes |
segments that challenge harmful gender stereotypes and promote positive attitudes towards
gender equality and GBV prevention |
program schedules, and listener feedback | submitted to Donor/Stakehol ders | |||||||||
| THEMATIC AREA 6: SKILLS & SUSTAINABLE LIVELIHOOD DEVELOPMENT. | |||||||||||||
| SO 5.11 To contribute to poverty reduction by Fostering socio-economic resilience and sustainable livelihoods among vulnerable populations | |||||||||||||
| 5.11 .1
Vocational skills training) to 250 AGYW, youth, OVC and their households |
No. of beneficiarie s trained in
vocational skills |
The no. of
AGYW, youth, OVC, and their household members who receive vocational skills training |
Training attendance records, participant lists, and
skills assessment reports |
0 | 250 | 50 | 50 | 50 | 50 | 50 | Annually | Livelihoods
Program Coordinator |
|
| No. of beneficiarie s who start their own businesses or find
employmen t |
The No. of
AGYW, youth, OVC, and their household members who receive vocational skills training |
Training attendance records, participant lists, and skills
assessment reports |
0 | 250 | 50 | 50 | 50 | 50 | 50 | Annually | Livelihoods
Program Coordinator |
||
| 5.11.2
Entreprene urship and business skills training to 500 AGYW, Youths and OVCs |
No. of beneficiarie
s trained in entreprene urship and business skills |
The no. of
AGYW, Youths, and OVCs who receive training in entrepreneurship and business skills to enhance their economic empowerment and self-reliance |
Training attendance records, participant lists, and
skills assessment reports0 |
0 | 100 | 100 | 100 | 100 | 100 | 100 | Quarterly | Livelihoods
Program Coordinator |
Quarterly
Progress Report (QPR) submitted to Donor/Stakehol ders |
| No. of beneficiarie s who start their own businesses or expand
existing ones |
The no. of
AGYW, Youths, and OVCs who start their own businesses or expand existing ones after receiving entrepreneurship and business skills training |
Business registration records, beneficiary surveys, and program monitoring reports | 0 | 300 | 60 | 60 | 60 | 60 | 60 | Quarterly | Livelihoods
Program Coordinator |
Quarterly
Progress Report (QPR) submitted to Donor/Stakehol ders |
|
| No. of groups established and provided with startup kits | The no. of groups formed by
trained beneficiaries, categorized by their respective training areas, and provided with start-up kits to support their entrepreneurial ventures |
Group
registration records, beneficiary surveys, and program monitoring reports |
0 | 5 | 1 | 1 | 1 | 1 | 1 | One-time | Livelihoods
Program Coordinator |
Final Progress Report submitted to Donor/Stakehol ders | |
| No. of individuals in each group | The no.of trained beneficiaries who are part of each established group, receiving start-up kits and support to launch their entrepreneurial ventures | Group membership records, beneficiary surveys, and program monitoring reports | One-time
(after group formation |
Livelihoods
Program Coordinator |
Final Progress Report submitted to Donor/Stakehol ders | ||||||||
| 5.11.4 Life skills training for 500
AGYW, youths and OVCs |
No. of beneficiarie
s trained in life skills |
The no. of
AGYW, youths, and OVCs who receive training in essential life skills, including communication, decision-making, problem-solving, and leadership |
Training attendance records, participant lists, and
skills assessment reports |
0 | 500 | 100 | 100 | 100 | 100 | 100 | Quarterly | Life Skills
Program Coordinator |
Quarterly
Progress Report (QPR) submitted to Donor/Stakehol ders |
| No. of beneficiarie s who demonstrat e improved self-esteem and confidence | The no. of
AGYW, youths, and OVCs who show increased self-esteem and confidence, as measured by surveys, focus groups, or interviews, after receiving life skills training |
Beneficiary surveys, focus groups, and interviews | 0 | 400 | 80 | 80 | 80 | 80 | 80 | Quarterly | Life Skills
Program Coordinator |
Quarterly
Progress Report (QPR) submitted to Donor/Stakehol ders |
|
| 5.11.5
Computer literacy and digital skills training to 250 AGYW, and Youths |
No. of beneficiarie
s trained in computer literacy and digital skills |
The no. of
AGYW and youths who receive training in computer literacy and digital skills, including basic computer operations, online safety, and digital tools for entrepreneurship and employment |
Training attendance records, participant lists, and
skills assessment reports |
0 | 250 | 50 | 50 | 50 | 50 | 50 | Quarterly | Digital Skills
Program Coordinator |
Quarterly
Progress Report (QPR) submitted to Donor/Stakehol ders |
| No. of beneficiarie s who demonstrat
e improved ability to use computers and digital tools |
The no. of
AGYW and youths who show increased proficiency in using computers and digital tools, as measured by skills assessments, quizzes, or practical exercises, after receiving computer literacy and digital skills training |
Skills
assessments, quizzes, practical exercises, and beneficiary feedback |
0 | 200 | 40 | 40 | 40 | 40 | 40 | Quarterly | Digital Skills
Program Coordinator |
Quarterly
Progress Report (QPR) submitted to Donor/Stakehol ders |
|
| THEMATIC AREA 7: ENVIRONMENT AND CLIMATE CHANGE | |||||||||||||||
| SO, 5.12 Strengthen Environmental protection and uptake of Climate resilience/protection Technologies in 50 Schools and 50 health facilities in response to Climate Change | |||||||||||||||
| 5.12.1
Planting Trees and Grass on 50 school and 50 health facility compounds |
No. of school
compounds with trees and grass planted |
|
Planting records, site
visits, and school administrator feedback |
0 | 50 | 10 | 10 | 10 | 10 | 10 | One-time
(after planting) |
Environmental
Program Coordinator |
Final Progress Report submitted to Donor/Stakehol ders | ||
| No. of health
facility compounds with trees and grass planted |
The no. of health
facility compounds where trees and grass have been planted, aiming to improve the environment, reduce soil erosion, and create a conducive healthcare environment |
Planting records, site visits, and
health facility administrator feedback |
0 | 50 | 10 | 10 | 10 | 10 | 10 | One-time
(after planting) |
Environmental
Program Coordinator |
Final Progress Report submitted to Donor/Stakehol ders | |||
| No. of trees and grasses planted | The total no. of trees and grasses planted in school
and health facility compounds, aiming to improve the environment, |
Planting records, site
visits, and administrator feedback |
0 | 5000 | 1000 | 1000 | 1000 | 1000 | 1000 | One-time
(after planting) |
Environmental
Program Coordinator |
||||
| reduce soil erosion, and create a conducive learning and healthcare environment | |||||||||||||
| 5.12.2 Installation of Clean Energy Cooking technology (Solar, biogas) in 20 high volume boarding primary and secondary schools | No. of schools with clean energy cooking
technology installed |
The no. of highvolume boarding primary and secondary schools where clean energy cooking technology (solar, biogas) has been installed, aiming to reduce reliance on fossil fuels, decrease carbon emissions, and improve air quality | Installation records, site
visits, and school administrator feedback |
0 | 20 | 4 | 4 | 4 | 4 | 4 | One-time
(after installation) |
Clean Energy
Program Coordinator |
|
| 5.12.3
Training of 250 teachers, SMC, PTA, HUMC, health workers, Environme ntal officers on Climate change resilience |
No. of trainees on climate change resilience | The no. of teachers, SMC,
PTA, HUMC members, health workers, and Environmental officers trained on climate change resilience, aiming to enhance their knowledge and skills to address climate-related challenges |
Training attendance records, participant lists, and evaluation forms | 0 | 250 | 50 | 50 | 50 | 50 | 50 | Annually | Climate Change
Resilience Program Coordinator |
Final Progress Report submitted to Donor/Stakehol ders |
| No. of trainees applying climate change resilience practices in their work | The no. of trainees who demonstrate application of climate change resilience practices in their daily work, aiming to enhance
resilience in schools, communities, and institutions |
Follow-up surveys, interviews, and observations | 0 | 200 | 40 | 40 | 40 | 40 | 40 | Annual-
6months after training. |
Climate Change
Resilience Program Coordinator |
Progress Report submitted to Donor/Stakehol ders | |
| 5.12.3 Installation of Lighting rods/condu ctors on 50 Health
facilities and 50 Schools |
No. of health
facilities and schools with lightning rods/condu ctors installed |
– The no. of health facilities and schools where lightning rods/conductors have been installed, aiming to protect lives and property from lightning strikes
|
Installation records, site visits, and
facility administrator feedback |
0 | 100 facilities (50 health facilities + 50 schools) | 20 | 20 | 20 | 20 | 20 | Bi-annually | Infrastructure
Program Coordinator |
Reporting To:
– Infrastructure Program Manager
Progress Report submitted to Donor/Stakehol ders |
| 5.12.4
Annual Climate change education and awareness campaigns |
No. of participants reached through climate change education and awareness campaigns | The no. of
individuals reached through climate change education and awareness campaigns, aiming to enhance knowledge and promote action on climate change |
Campaign records, participant lists, and evaluation forms | 0 | 50,000 | 10000 | 10000 | 10000 | 10000 | 10000 | Annually | Climate Change
Education Coordinator |
Annual
Progress Report submitted to Donor/Stakehol ders |
| THEMATIC AREA 8: EDUCATION FOR WOMEN, YOUTHS&CHILDREN | |||||||||||||
| SO:5.13: Improve the quality, accessibility, and inclusivity of education for 2500 disadvantaged groups by 2028 through capacitybuilding for educators, fostering youth leadership in extracurricular activities, and promoting gender equality in the learning environment | |||||||||||||
| 5.13.1
Construct or rehabilitate a school in targeted area. |
No. of schools constructe d or rehabilitate d | The no. of schools constructed or rehabilitated in the targeted area, aiming to provide
a safe and conducive learning environment |
Construction
/rehabilitatio n records, site visits, and school administrator feedback |
0 | One-time
(after construction /rehabilitatio n) |
0 | 1 | 0 | 0 | 0 | One-time
(after construction /rehabilitatio n) |
Infrastructure
Program Coordinator |
Final Progress Report submitted to Donor/Stakehol ders |
| No. of students
benefiting from improved educational infrastructu re |
The no. of students benefiting from the constructed or rehabilitated school, aiming to improve access to quality education | School enrollment records,
student lists, and beneficiary feedback |
0 | 500 | 100 | 100 | 100 | 100 | 100 | One-time
(after construction /rehabilitatio n) |
Infrastructure
Program Coordinator |
Final Progress Report submitted to Donor/Stakehol ders | |
| 5.13.2 Mobilize scholastic materials, uniforms, sanitary pads and School fees for 5000 disadvantag ed students. | No. of students receiving scholastic materials | The no. of students receiving scholastic materials, aiming to improve access to quality education and enhance learning outcomes | –
Distribution records
lists
|
0 | 5000 | 1000 | 1000 | 1000 | 1000 | 1000 | Quarterly |
Program Manager: Overall responsibility
|
Program Management Team – Donors/Fundin g Agencies |
| No. of students receiving uniforms | The total no. of students receiving uniforms, aiming to improve access to quality | –
Distribution records – Student lists |
0 | 5000 | 1000 | 1000 | 1000 | 1000 | 1000 | Annually:
Comprehens ive report |
– Education
Program Manager: Overall responsibility |
Education |
|
| education and enhance learning outcomes. | – Beneficiary feedback |
|
–
Donors/Fundin g Agencies – Program Website |
||||||||||
| No. of female students receiving sanitary pads | The total no. of female students receiving sanitary pads, aiming to improve access to menstrual health and hygiene, and enhance learning outcomes. | –
Distribution records
lists
|
Quarterly: Progress reports |
Program Manager: Overall responsibility
Hygiene Officer: Leading program implementation
|
Program Management Team – Donors/Fundin g Agencies |
||||||||
| No. of students with paid school fees | The total no. of students with paid school fees, aiming to improve access to quality education and reduce financial barriers to learning. |
lists |
0 | 5000 | 1000 | 1000 | 1000 | 1000 | 1000 | Annually:
Comprehens ive report |
Program Manager: Overall responsibility
|
– Donors/Fundin g Agencies
Website |
|
| 5.13.3
Conduct biannual training workshops for 100 teachers on modern |
No. of teachers
trained on modern pedagogy and child- |
The total no. of teachers trained on modern pedagogy and child-centered learning, aiming to improve teaching methods |
|
0 | 20 | 20 | 20 | 20 | 20 | 20 |
Comprehens ive report |
Program Manager: Overall responsibility
Officer: Leading |
Program |
| pedagogy and childcentered learning | centered learning | and enhance student learning outcomes. | – Participant feedback forms | workshop implementation
– M&E Officer: Data collection, analysis, and reporting |
Management
Team – Donors/Fundin g Agencies
Donors/Fundin g Agencies
Website |
||||||||
| 5.13.4
Conduct 20 quarterly awareness campaigns and events to raise awareness about the importance of girls’ education and women’s empowerm ent. among community members. |
No. of campaigns and events
conducted to raise awareness about girls’ education and women’s empowerm ent |
The total no. of campaigns and events conducted to raise awareness about
girls’ education and women’s empowerment among community members, aiming to change attitudes and behaviors towards gender equality. |
|
0 | 20 campaigns and events (4 per year for 5 years) | 4 | 4 | 4 | 4 | 4 |
Comprehens ive report |
Engagement Officer: Leading campaign and event implementation
Program Manager: Overall responsibility |
Program Management Team – Donors/Fundin g Agencies
Donors/Fundin g Agencies
Website |
| No. of community members reached through awareness campaigns and events | The total no. of community members reached through awareness campaigns and events, aiming to raise awareness
about girls’ education and women’s empowerment. |
|
0 | 10,000 community members | 2000 | 2000 | 2000 | 2000 | 2000 | Quarterly: Progress reports |
Engagement Officer: Leading campaign and event implementation
Program Manager: Overall responsibility |
Program Management Team – Donors/Fundin g Agencies |
|
| 5.13.5
Distribute 10,000 IEC materials to raise awareness about the importance of girls’ education and women’s empowerm ent among community members |
No. of IEC (Informatio n,
Education, and Communic ation) materials distributed |
The total no. of IEC materials distributed to raise awareness about the importance of
girls’ education and women’s empowerment among community members. |
–
Distribution records
|
0 | 10,000 | 2000 | 2000 | 2000 | 2000 | 2000 | Quarterly: Progress reports |
Engagement Officer: Leading distribution efforts
Program Manager: Overall responsibility |
Program Management Team – Donors/Fundin g Agencies |
| No. of community members reached through IEC materials distribution | The total no. of community members reached through the distribution of IEC materials, aiming to raise awareness about the importance
of girls’ education and women’s empowerment. |
–
Distribution records
|
0 | 20000 | 4000 | 4000 | 4000 | 4000 | 4000 |
Comprehens ive report |
Engagement Officer: Leading distribution efforts
Program Manager: |
Program Management Team – Donors/Fundin g Agencies |
| Overall responsibility |
– Donors/Fundin g Agencies
Website |
||||||||||||
| No. of community
-led initiatives or activities promoting girls’ education and women’s empowerm ent |
The total no. of community-led
initiatives or activities that promote girls’ education and women’s empowerment, aiming to sustain community engagement and ownership. |
evaluation visits
|
0 | 1 | 1 | 1 | 1 | 1 | 1 | – Annually:
Comprehens ive report |
Engagement Officer: Supporting community-led initiatives
Program Manager: Overall responsibility
|
Gender and Social Development – Donors/Fundin g Agencies
Website |
|
| 5.13.6
Provide Accessible infrastructu re like wheelchair, wide doors, handrails etc. in 50 schools for students with disabilities |
No. of schools with accessible infrastructu re for students
with disabilities |
The total no. of schools that have been modified to include accessible infrastructure, such as wheelchairs, wide doors, and handrails, to
facilitate inclusive education for students with disabilities. |
– Infrastructur e modification records
|
0 | 50 | 10 | 10 | 10 | 10 | 10 | Quarterly |
Education Officer: Leading infrastructure modification efforts
Program Manager: Overall responsibility |
Program Management Team – Donors/Fundin g Agencies |
| No. of students
with disabilities benefiting from accessible infrastructu re |
The total no. of students with disabilities who are able to access and benefit from inclusive education due to the modification of school infrastructure, aiming to improve their
learning outcomes and participation. |
|
0 | 500 | 100 | 100 | 100 | 100 | 100 | Quarterly: Progress reports |
Monitoring student participation
Program Manager: Overall responsibility |
Program Management Team – Donors/Fundin g Agencies |
|
| 5.13.7
Establish and support 50 school clubs and youth-led initiatives. |
No. of school clubs and youth-led initiatives established and supported | The total no. of school clubs and youth-led initiatives that have been established and supported to promote girls’
education, women’s empowerment, and inclusive education. |
|
0 | 50 | 10 | 10 | 10 | 10 | 10 | Quarterly: Progress reports |
Engagement Officer: Supporting club establishment and activities
Program Manager: |
Program Management Team – Donors/Fundin g Agencies |
| No. of student participants in school clubs and youth-led initiatives | The total no. of students who participate in school clubs and youth-led initiatives that promote girls’
education, women’s empowerment, and inclusive education. |
|
0 | 200 | 200 | 200 | 200 | 200 | 200 | Quarterly: Progress reports |
Engagement Officer: Monitoring club participation
Program Manager: Overall responsibility |
Program Management Team – Donors/Fundin g Agencies |
| 5.13.8
Organize sports and cultural activities to promote teamwork, discipline, and a sense of community in 50 schools |
No. of schools with organized sports and cultural activities | The total no. of schools that have organized sports and cultural activities to
promote teamwork, discipline, and a sense of community among students. |
|
0 | 50 | 10 | 10 | 10 | 10 | 10 | Quarterly: Progress reports |
Activities Coordinator: Organizing sports and cultural activities
Program Manager: Overall responsibility |
Program Management Team – Donors/Fundin g Agencies |
| No. of student participants in sports and cultural activities | The total no. of students who participate in organized sports and cultural
activities in schools, aiming to promote teamwork, discipline, and a sense of community. |
|
0 | 2000 | 400 | 400 | 400 | 400 | 400 | Quarterly: Progress reports |
Activities Coordinator: Monitoring student participation
Program Manager: Overall responsibility |
Program Management Team – Donors/Fundin g Agencies |
|
| THEMATIC AREA 9: ORPHANS AND VULNERABLE CHILDREN IN GREATER JINJA | |||||||||||||
| SO, 5.14: Contribute to the reduction in child poverty and deprivation through comprehensive prevention and response programs.
|
|||||||||||||
| 5.14.1:
Identify and register 1000 OVCs |
No. of
Orphans and Vulnerable Children (OVCs) |
The total no. of OVCs who have been identified and registered to |
|
0 | 1000 | 200 | 200 | 200 | 200 | 200 | Quarterly: Progress reports | – OVC
Coordinator: Leading identification |
– Quarterly progress reports to: |
| identified and registered | receive support and services. |
|
and registration efforts
|
– Program
Management Team – Donors/Fundin g Agencies |
|||||||||
| 5.14.2: Support access to business financial
services for 250 OVC households through microfinan ce agencies. |
No. of
OVC households accessing business financial services |
The total no. of OVC households that have accessed business financial services, such as loans, savings, and training, to improve their economic stability. |
|
0 | 250 | 50 | 50 | 50 | 50 | 50 | Quarterly: Progress reports |
Officer: Facilitating access to financial services
|
Management Team – Donors/Fundin g Agencies |
| No. of
OVC households receiving training on financial literacy and entreprene urship |
The total no. of OVC households that have received training on financial literacy and entrepreneurship to improve their
economic stability and selfsufficiency. |
|
0 | 250 | 50 | 50 | 50 | 50 | 50 | Quarterly |
Officer: Organizing training sessions
|
Management Team – Donors/Fundin g Agencies |
| No. of
OVC households receiving training on financial literacy and entreprene urship |
The total no. of OVC households that have received training on financial literacy and entrepreneurship to improve their
economic stability and selfsufficiency. |
|
0 | 250 | 50 | 50 | 50 | 50 | 50 | Quarterly: Progress reports |
Officer: Organizing training sessions
|
Management Team – Donors/Fundin g Agencies |
|
|
5.14.3: Facilitate access to market informatio n for 500 OVC households to help them sell their products. |
No. of
OVC households accessing market information |
The total no. of OVC households that have received access to market information, enabling them to make informed decisions about their products and sales. |
|
0 | 500 | 100 | 100 | 100 | 100 | 100 | Quarterly: Progress reports |
Access Officer: Facilitating market information sessions
|
Management Team – Donors/Fundin g Agencies |
| No. of
OVC households receiving training on market research and product pricing |
The total no. of OVC households that have received training on market research and product pricing, enabling them to make informed decisions about their products and sales. |
|
0 | 500 | 100 | 1000 | 100 | 100 | 100 | Quarterly: Progress reports |
Access Officer: Organizing training sessions
|
Management Team – Donors/Fundin g Agencies |
| No. of
OVC households linked to market opportuniti es and buyers |
The total no. of OVC households that have been connected to market opportunities and buyers, enabling them to sell their products and increase their income. |
|
0 | 400 | 80 | 80 | 80 | 80 | 80 | Quarterly: Progress reports |
Access Officer: Facilitating market linkages
|
Management Team – Donors/Fundin g Agencies |
|
|
5.14.4: Provide social assistance to 500 OVC households to address hunger and malnutritio n |
No. of
OVC households receiving social assistance to address hunger and malnutritio n |
The total no. of OVC households that have received social assistance, such as food aid, nutritional support, or cash transfers, to address hunger and malnutrition. |
|
0 | 500 | 100 | 100 | 100 | 100 | 100 | Quarterly: Progress reports |
Protection Officer: Coordinating assistance distribution
|
Management Team – Donors/Fundin g Agencies |
| 5.14.5: Provide high quality agricultural inputs/tools seeds/planti ngs and stocking materials to 500
OVC households |
No. of
OVC households receiving agricultural inputs and support |
The total no. of OVC households that have received highquality agricultural inputs, tools, seeds/plantings, and stocking materials to improve their agricultural productivity and income. | –
Distribution records of agricultural inputs and tools
|
0 | 500 | 100 | 100 | 100 | 100 | 100 | Quarterly: Progress reports |
Coordinating input distribution
|
Management Team – Donors/Fundin g Agencies |
| No. of caregivers participatin g in
economic empowerm ent opportuniti es |
The total no. of caregivers of
OVC who have participated in economic empowerment opportunities, such as vocational training, business skills development, and incomegenerating activities. |
– Participation records in incomegenerating activities
economic stability
|
0 | 500 | 100 | 100 | 100 | 100 | 100 | Quarterly: Progress reports |
Officer: Organizing training and activities
|
Management Team – Donors/Fundin g Agencies |
|
|
5.14.6: Establish and train 100 VHT and encourage them to make OVC a key priority and target group. |
No. of
VHTs (Village Health Teams) established and trained |
The total no. of VHTs established and trained to prioritize and support OVC, enhancing their health, wellbeing, and access to essential services. |
|
0 | 100 | 20 | 20 | 20 | 20 | 20 | Quarterly: Progress reports |
Health Officer: Establishing and training VHTs
|
Management Team – Donors/Fundin g Agencies |
| No. of VHTs
actively providing support to OVCs |
The total no. of VHTs actively providing support to OVCs, including home visits, counseling, and referrals to essential services. |
activity reports
|
0 | 90 | 18 | 18 | 18 | 18 | 18 | Quarterly: Progress reports |
Health Officer: Supervising VHT activities
|
Quarterly progress reports to:
– Program Management Team – Donors/Fundin g Agencies |
| No. of
OVCs receiving regular home visits and support from VHTs |
The total no. of
OVCs receiving regular home visits and support from VHTs, including counseling, health monitoring, and referrals to essential services. |
visitation records
activity reports |
o | 500 | 100 | 100 | 100 | 100 | 100 | Quarterly |
Health Officer: Supervising VHT activities
|
Management Team – Donors/Fundin g Agencies |
|
| 5.14.8
Provide Psychosoci al, Child Protection and Legal Support to 1000 OVC. |
No. of
OVC receiving Psychosoci al, Child Protection, and Legal Support |
The total no. of OVC receiving comprehensive support, including psychosocial counseling, child protection services, and legal assistance to address their unique needs and vulnerabilities |
(psychosocial , child protection, legal)
files
|
0 | 1000 | 200 | 200 | 200 | 200 | 200 | Quarterly: Progress reports |
Protection Officer: Coordinating support services
|
Management Team – Donors/Fundin g Agencies |
| THEMATIC AREA 10: ROMIC MEDICAL CENTRE | |||||||||||||
| SO, 15. To provide accessible and affordable medical care services to vulnerable communities, improving their overall health and well-being. | |||||||||||||
| 5.15.1.
General Medical Services |
No. of vulnerable people receiving outpatient consultatio ns and treatment per day | The average no. of vulnerable individuals, including OVC, receiving outpatient consultations and treatment per day, including medical exams, | – Outpatient department records
– Consultation and treatment logs |
0 | 50 vulnerable people per day
Totaling to 18000 Per year. |
18000 | 18000 | 18000 | 18000 | 18000 |
Outpatient department records
|
|
Management Team |
| diagnoses, and medication. |
|
– Annually:
Comprehens ive report |
– Program Manager: Overall responsibility | –
Donors/Fundin g Agencies
Health – Donors/Fundin g Agencies
Website |
|||||||||
| No. of people receiving maternal and child health services per day | The average no. of individuals,
including pregnant women, new mothers, and children under 5, receiving essential maternal and child health services per day, including antenatal care, delivery services, postnatal care, immunizations, and child health check-ups. |
– Immunization and child health checkup registers
|
0 | 10 people per day
Totaling To3600 |
3600 | 3600 | 3600 | 3600 | 3600 |
Maternal and child health service records
Comprehens ive report |
|
Management Team – Donors/Fundin g Agencies
– Donors/Fundin g Agencies
|
|
| 5.15.2.
Medicolega l Services |
No. of survivors receiving
medicolega l services per day |
The average no. of survivors of SGBV receiving medicolegal services per day, including medical examination, documentation of evidence, and court testimony support. |
files
|
0 | 20 survivors per day Totaling
To 7200 Per year |
7200 | 7200 | 7200 | 7200 | 7200 |
Medicolegal service records
Comprehens ive report |
|
Management Team – Donors/Fundin g Agencies |
| Overall responsibility |
Donors/Fundin g Agencies
Website |
||||||||||||
| 5.15.3. Laboratory Services: | No. of vulnerable people receiving laboratory services per day | The average No.
of vulnerable individuals, including OVC, receiving essential laboratory services per day. |
|
0 | 50 vulnerable people per day
Totaling to 18000 Per year. |
18000 | 1800 | 1800 | 1800 | 1800 |
Laboratory service records
Comprehens ive report |
|
|
| 5.15.4.
Communit y Outreach and Engagemen t: |
No. of health fairs and outreach programs organized per quarter | The total no. of health fairs and outreach programs organized per quarter, aimed at promoting health awareness, providing health education, and increasing access to health services for vulnerable populations. |
|
0 | 4 health fairs/outreac h programs per quarter | 16 | 16 | 16 | 16 | 16 | Quarterly: Program
activity reports |
Community
Outreach Officer: Organizing health fairs/outreach programs |
Management Team – Donors/Fundin g Agencies |
| No. of local leaders engaged per quarter | The total no. of local leaders,
including community elders, religious leaders, and government officials, engaged in program activities per |
|
0 | 250 | 50 | 50 | 50 | 50 | 50 | – Annually:
Comprehens ive report |
Engagement Officer: Engaging local leaders
|
Health – Donors/Fundin g Agencies |
|
| quarter, aimed at promoting program goals
and increasing community support. |
– Verification visits | – Program Manager: Overall responsibility | – Program
Website |
||||||||||
| 5.15.5.
Capacity Building and Quality Improveme nt: |
No. of medical
staff receiving training and capacitybuilding programs |
The total no. of medical staff, including doctors, nurses, and other healthcare workers, receiving training and capacitybuilding programs per quarter, aimed at improving their skills and knowledge in providing quality healthcare services. |
|
0 | 15 per year | 15 | 15 | 15 | 15 | 15 | Quarterly: Training records | Training Officer: Organizing training programs |
Management Team – Donors/Fundin g Agencies |
8.0 ORGANIZATIONAL BUDGET FOR ROCAF 2025/2026, (1USD RATED AT 3650UGX)
| REVENUE | AMOUNT(SHS) | AMOUNT(USD) |
| Grants | 2,323,905,000 | 636,686 |
| Contributions by directors | 77,463,500 | 21,223 |
| Contributions by individuals | 123,941,600 | 33,957 |
| Membership | 30,985,400 | 8,489 |
| Romic medical Centre. | 309,854,000 | 84,892 |
| Sales of agricultural produces | 154,927,000 | 42,446 |
| Social enterprise | 77,463,500 | 21,223
|
| TOTAL REVENUE | 3,098,540,000 | 848,915 |
| EXPENDITURE | ||
| Staff Salary and Benefits | 180,000,000 | 49,315 |
| Thematic Area 1: HIV/AIDs. | 278,500,000 | 76,301 |
| Thematic Area 2: Tb Prevention, Care and Treatment | 116,000,000 | 31,781 |
| Thematic Area3: Malaria | 352,400,000 | 96,548 |
| Thematic Area 4: Wash/Nutrition | 429,840,000 | 117,764 |
| Thematic Area 5: Gender-Based Violence | 210,600,000 | 57,699 |
| Thematic Area 6: Socio-Economic Empowerment | 69,000,000 | 18,904 |
| Thematic Area 7: Environment and Climate Change | 89,000,000 | 24,384 |
| Thematic Area 8: Education for Women, Youths Children | 472,200,000 | 129,370 |
| Thematic Area 9: Orphans and Vulnerable Children | 458,000,000 | 125,479 |
| Thematic Area 10: Romic Medical Centre | 443,000,000 | 121,370 |
| TOTAL REVENUE | 3,098,540,000 | 848,915 |